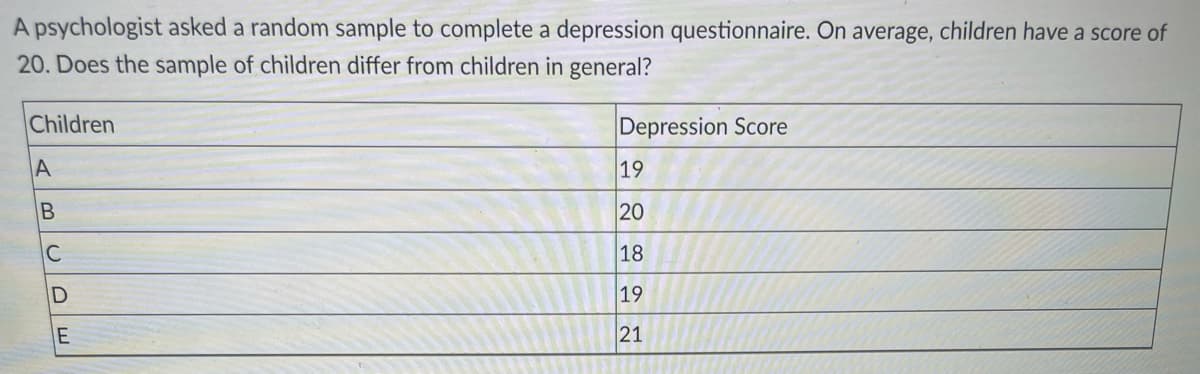
A psychologist asked a random sample to complete a depression questionnaire. On average, children have a score of 20. Does the sample of children differ from children in general? Children Depression Score 19 20 C 18 19 21


Q: Claim population mean more than 10.3 Test statistics z= 2.3 P value = ?
A: Here, the known values are, Population mean, μ=10.3Test statistic, z=2.3
Q: A psychologist asked a random sample to complete a depression questionnaire. On average, children…
A: Given n=5 Df= ?
Q: The researchers from a study interviewed two random samples, one in 2015 and one in 2018. Both…
A: Read a print book 2015 2018 total Yes 1195 1372 2567 No 726 605 1331 total 1921 1977
Q: Researchers wondered there was a difference between males and females in regard to some common…
A: Given: Total males surveyed =507 Males having annoying behavior =168 Total females =570 Females…
Q: A researcher conducted a study to find out how parents felt about the Ministry of Education's…
A: Given : Chi square test statistic = 20.704 Variables : Gender , decision (yes or no) Total number of…
Q: A single sample t-test should be conducted to see if there is a difference between which of the…
A: A single sample t-test A single sample t-test is used to see there is a difference between sample…
Q: According to a study conducted by a statistical organization, the proportion of people who are…
A: Using the given data select choices
Q: A Canadian longitudinal study, examine whether giving antibiotics in infancy increases the…
A:
Q: Scores on a certain exam are normally distributed with a mean of 78 and a variance of 25. What is…
A: Given information- Population mean, μ = 78 Population variance, σ2=25 So, population standard…
Q: Student SAT Score Exam grade 1 620 82 2 750 98 500 76 4 520 68 5 540 84 6. 690 99 7 590 67 8 490 58…
A:
Q: Test the hypothesis at the 1% significance level Cell 1 2 3…
A: To test the hypothesis we find mean and standard deviation, Mean= Summation (fiXi)/(summation fi)…
Q: A psychologist asked a random sample to complete a depression questionnaire. On average, children…
A: The hypothesis test is a statistical method in which one using the sample data try to check the…
Q: A psychologist asked a random sample to complete a depression questionnaire. On average, children…
A: We have given that Sample size n=5 , Data :- 19 , 20 , 18 , 19 , 21
Q: A quiz was given in a nursing class. The results of scores and number of students achieving the…
A:
Q: Researchers wondered if there was a difference between males and females in regard to some common…
A: Hypothesis tests are conducted to test the significant difference between two population…
Q: 11. A random variable, Y, has a mean of 50 and a variance of 25. What is the variance of 2Y+ A) 10…
A:
Q: Pulse Rates Listed below are pulse rates (beats per minute) from samples of adult males and females…
A: Measures of variation:Consider the measures of variations (coefficient variation, range, variance,…
Q: Part 2: The director of student services at Oxnard College is interested in whether women are less…
A:
Q: he following data were obtained from a repeated-measures research study. What is the value the…
A: The difference column can be calculated as
Q: consider the data. Xi Yi 6. 19 13 25 6. 10 a.) Find the value of the test statistic. b.) Find the…
A: See the solution
Q: Forbes reports that women in general trust recommendations from Pinterest more than recommendations…
A:
Q: A doctor at a clinic wants to determine if its oral and ear thermometers measure the same body…
A: c) The mean and standard deviation for ear are obtained as given below:…
Q: Which of the following is not a data collection method? a. Watching TV b. Observation c.…
A: Solution :-
Q: Q1. Occupational prestige scores for a sample of fathers and their oldest son and oldest daughter ai…
A: Note: Hi there! Thank you for posting the question. As your question has more than 3 parts, we have…
Q: One morning a local affiliate of national public radio show had an episode about parks in Idaho.…
A: Hello, since your question has multiple sub-parts, we will solve the first three sub-parts for you.…
Q: We are interested in determining whether or not the medication was effective in curing the common…
A:
Q: With a paired-samples t test, you will usually compare the sample mean for the difference score to…
A:
Q: According to a retail organization, holiday shoppers spent an average of $935.58 over the…
A: From the provided information, Sample size (n) = 16 Level of significance (α) = 0.05
Q: A doctor studies the side effects of a drug on male and female. Following data was obtained for a…
A: Hello! As you have posted more than 3 sub parts, we are answering the first 3 sub-parts. In case…
Q: a) STEP 1: Set up H0 and Ha b) What is the sample proportion of students who have pierced…
A: 1.a) Let p denotes the population proportion of all students at SFC who have pierced something other…
Q: Random students are selected from a history class and asked the number of hours they studied for a…
A: Note: Hi there! Thank you for posting the question. As there are several independent questions,…
Q: What percent of students scored a D on their essay? PF19.PNG Q Q Search Essay Grade Data 10 9. 36%…
A: From the relative frequency graph we can make a table of relative frequency; Let the percent of…
Q: ΟΥ σχ i) Find the mean and variance of the statistic T = 10 Σtwi2 Σ112,2 10 i=1
A:
Q: Exercises 8: Is gender independent of education level? A random sample of 395 people were surveyed…
A:
Q: According to a study conducted by a statistical organization, the proportion of people who are…
A:
Q: Answer the questions below. Use a=.05. Source SS D MS F Between 120 4…
A: As per our guidelines we can solve first three subpart and rest can be reposted. Solution-: We have…
Q: In a large class of introductory Statistics students, the professor has each person toss a fair coin…
A: a) The coin tossed 13 times and calculate the proportions and plot a histogram of using several…
Q: AP Stats Free Response - Period 6 Name, Date_ Many people consider Fosco University every ye ar for…
A: Note: Since you have posted multiple independent questions in the same request, we will solve the…
Q: An economist wonders if corporate productivity in some countries is more volatile than in other…
A: Since you have posted a question with multiple sub-parts, we will solve first three sub-parts for…
Q: Part 2 Q2: Put (True) or (False). Write True or False for six questions from the following question.…
A: The variance of the estimator is inversely proportional to the sample size, So if the sample…
Q: According to a study conducted by a statistical organization, the proportion of people who are…
A: Introduction: A variable is considered to be qualitative, if its possible outcomes are labels or…
Q: 4. What type of data would necessitate using a hypothesis test of the population pra rather than a…
A: A qualitative type of data in which we are receiving responses like Yes and No would require…
Q: To determine whether caffeine consumption affects the ability to solve math problems, a researcher…
A: According to the provided data, the number of problems solved is normally distributed in each group,…
Q: A college student is interested in whether presoaking time has an effect on cleanliness of clothing.…
A: Given:
Q: A market research firm has carried out an observational study on the chief executives from a random…
A: Given information An observational study has been carried on the chief executives from a random…
Q: A Canadian longitudinal study, examine whether giving antibiotics in infancy increases the…
A: “Since you have posted a question with multiple sub-parts, we will solve the first three subparts…
Q: An IQ score for which 15% of the population has a higher score and 85% have a lower score…
A: An IQ score is defined.
Q: uring final exam week, Mary had exams in psychology, art history, and biology. All three…
A: Given that It follows a normal distribution. We know that Whichever Z score is positive and more…
Q: To determine whether caffeine consumption affects the ability to solve math problems, a researcher…
A: Introduction:If the population standard deviation is unknown so that the sample standard deviation…

Step by step
Solved in 2 steps with 1 images

- A researcher surveyed 500 people. She found that the individuals who took some form of over the counter sleep aid (i.e. ZZZQuil) were able to fall asleep in a shorter period of time and stay asleep for longer periods than the individuals who did not. a) Was this study observational or experimental? Why?b) What was the explanatory variable? What was the response variable?A researcher randomly selected a sample of n = 500 individuals from a population with µ = 120 and administered an experimental treatment to the sample. What the researcher should expect if the treatment has no significant effect?The table below summarizes a data set that examines the responses of a random sample of college graduates and non-graduates on the topic of oil drilling. Complete a chi-square test for these data to check whether there is a statistically significant difference in responses from college graduates and non-graduates. That is, H0:H0: The opinion of college grads and nongrads is not different on the topic of drilling for oil and natural gas off the coast of California.HA:HA: Opinions regarding the drilling for oil and natural gas off the coast of California has an association with earning a college degree. Compute the expected counts. If necessary, round to the nearest tenth. College graduates Non-graduates Total Support 154 132 286 Oppose 180 126 306 Do not know 104 131 235 Total 438 389 827 College graduates Non-graduates Total Support 286 Oppose 306 Do not know 235 Total 438 389 827 b) Compute the χ2χ2 test statistic. Round to the nearest…
- Researchers are interested in the effectiveness of a new anti-retroviral medication at increasing 5 year survival for HIV infected persons with Hepatitis C. In order to test the efficacy of the new study drug, the researchers randomly assigned participants to receive either the new medication or a placebo. The following table summarizes preliminary results of the trial. Deceased Non-Deceased Total New Vaccine 55 84 139 Placebo 61 67 128 Total 116 151 267 A) Calculate the relative risk for mortality among those treated with the new vaccine versus the placebo. B) Interpret the relative risk measurement.A large research project showed that in a sample of 750 adults, 60 of them experienced a midlife crisis . Use this data to test the claim that the percentage of adults who experienced midlife crisis is less than 10%. Use (alpha)= 0.05 .In this study, ten combat veterans undergoing treatment for PTSD were randomly sampled from a local VA hospital in a study designed to test the efficacy of an anti-anxiety medication in reducing the symptoms of PTSD. Based on clinical animal trials, the researchers predict that the drug should reduce symptoms. t= 1.63, df=9, p=0.064, d= 0.529. Before: M= 48.100, SD=1.370, SE=0.433 After: M= 47.000, SD= 1.491, SE= 0.471 My hypotheses are; H0: μbefore ≤ μafter. H1: μbefore > μafter A. State your findings in APA format: B. How would you explain these findings to someone who has never taken a statistics class? In other words, use clear direct, non-jargon language to explain the results:
- New research suggests that the occurrence of celiac disease in a subject depends on the subject’s gender and whether the subject already has another autoimmune disorder (such as Hashimoto disease and/or Type I Diabetes). Researchers collected information from 860 patients complaining of gastrointestinal discomfort. data celiac; input gender $ hashimoto $ t1diabetes $ positive total; cards; female yes yes 27 124 female yes no 21 133 female no yes 22 117 female no no 16 109 male yes yes 14 95 male yes no 14 87 male no yes 9 97 male no no 11 99 ; run; title "Logistic model with gender"; proc logistic data=celiac; class gender (ref='male') / param=ref; model positive/total = gender; run; title "Logistic model with gender adjusted for presence of autoimune (t1diabetes and hashimoto) diseases"; proc logistic data=celiac; class gender (ref='male') / param=ref; class hashimoto (ref='no') / param=ref; class t1diabetes (ref='no') / param=ref; model positive/total = gender hashimoto…A pharmaceutical company wants to know whether an experimental drug has an effect on systolic blood pressure. Fifteen randomly selected subjects were given the drug and, after sufficient time for the drug to have an impact, their systolic blood pressures were recorded. The data appear below: 172140123130115 148108129137161 123152133128142172140123130115 148108129137161 123152133128142 Calculate the values of y¯¯¯y¯ and s for the 15 blood pressure readings.To examine the effects of pets and friends in stressful situations, researchers recruited 45 people to participate in an experiment. Fifteen of the subjects were randomly assigned to each of three groups to perform a stressful task alone (control group), with a good friend present, or with their dog present. Each subjects mean heart rate during the task was recorded. Higher heart rates mean more stress. Use an alpha of .05. Control Pets Friends n1=15 n2=15 n3=15 M1=82.52 M2=73.48 M3=91.33 s1=9.24 s2=9.97 s3=8.34 SS1=1195.29 SS2=1391.61 SS3=973.78 SSbetween = 2389.80 a) What are the hypotheses for this test?b) What is the critical valuec) Complete the necessary calculations (include post hocs if necessary) .d) Report your results in APA stylee) Interpret the results and include a source table.
- To examine the effects of pets and friends in stressful situations, researchers recruited 45 people to participate in an experiment. Fifteen of the subjects were randomly assigned to each of three groups to perform a stressful task alone (control group), with a good friend present, or with their dog present. Each subjects mean heart rate during the task was recorded. Higher heart rates mean more stress. Use an alpha of .05. Control Pets Friends n1=15 n2=15 n3=15 M1=82.52 M2=73.48 M3=91.33 s1=9.24 s2=9.97 s3=8.34 SS1=1195.29 SS2=1391.61 SS3=973.78 SSbetween = 2389.80 a) What are the hypotheses for this test?b) What is the critical valueTo examine the effects of pets and friends in stressful situations, researchers recruited 45 people to participate in an experiment. Fifteen of the subjects were randomly assigned to each of three groups to perform a stressful task alone (control group), with a good friend present, or with their dog present. Each subjects mean heart rate during the task was recorded. Higher heart rates mean more stress. Use an alpha of .05. Control Pets Friends n1=15 n2=15 n3=15 M1=82.52 M2=73.48 M3=91.33 s1=9.24 s2=9.97 s3=8.34 SS1=1195.29 SS2=1391.61 SS3=973.78 SSbetween = 2389.80 e) Interpret the results and include a source table.To examine the effects of pets and friends in stressful situations, researchers recruited 45 people to participate in an experiment. Fifteen of the subjects were randomly assigned to each of three groups to perform a stressful task alone (control group), with a good friend present, or with their dog present. Each subjects mean heart rate during the task was recorded. Higher heart rates mean more stress. Use an alpha of .05. Control Pets Friends n1=15 n2=15 n3=15 M1=82.52 M2=73.48 M3=91.33 s1=9.24 s2=9.97 s3=8.34 SS1=1195.29 SS2=1391.61 SS3=973.78 SSbetween = 2389.80 c) Complete the necessary calculations (include post hocs if necessary) .d) Report your results in APA style
