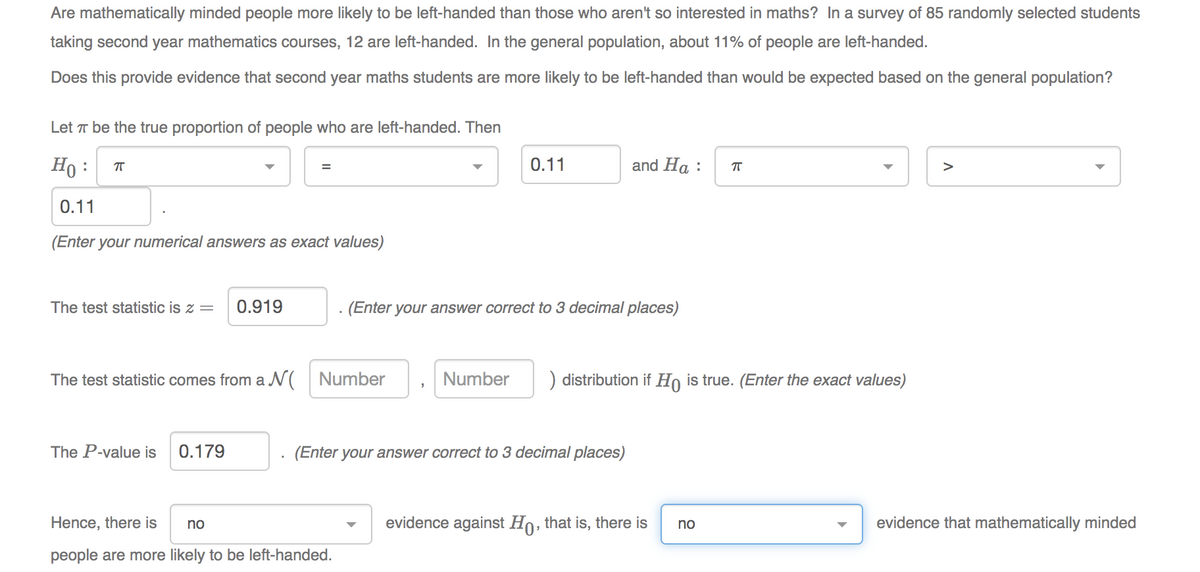
Are mathematically minded people more likely to be left-handed than those who aren't so interested in maths? In a survey of 85 randomly selected students taking second year mathematics courses, 12 are left-handed. In the general population, about 11% of people are left-handed. Does this provide evidence that second year maths students are more likely to be left-handed than would be expected based on the general population? Let T be the true proportion of people who are left-handed. Then Họ : 0.11 and Ha : > 0.11 (Enter your numerical answers as exact values) The test statistic is z = 0.919 · (Enter your answer correct to 3 decimal places) The test statistic comes from a N( Number Number ) distribution if Ho is true. (Enter the exact values) The P-value is 0.179 · (Enter your answer correct to 3 decimal places) Hence, there is no evidence against Ho, that is, there is no evidence that mathematically minded


Percentage
A percentage is a number indicated as a fraction of 100. It is a dimensionless number often expressed using the symbol %.
Algebraic Expressions
In mathematics, an algebraic expression consists of constant(s), variable(s), and mathematical operators. It is made up of terms.
Numbers
Numbers are some measures used for counting. They can be compared one with another to know its position in the number line and determine which one is greater or lesser than the other.
Subtraction
Before we begin to understand the subtraction of algebraic expressions, we need to list out a few things that form the basis of algebra.
Addition
Before we begin to understand the addition of algebraic expressions, we need to list out a few things that form the basis of algebra.
R2

Step by step
Solved in 2 steps


