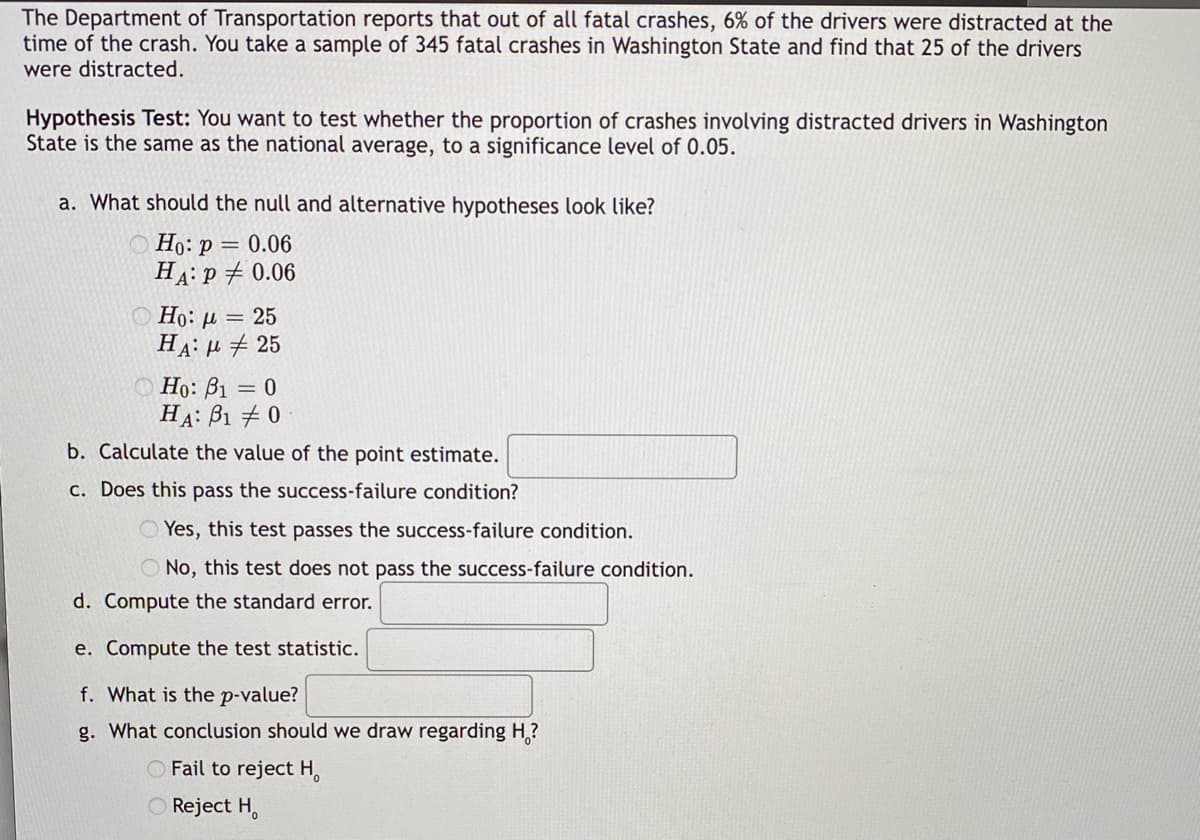
The Department of Transportation reports that out of all fatal crashes, 6% of the drivers were distracted at the time of the crash. You take a sample of 345 fatal crashes in Washington State and find that 25 of the drivers were distracted. Hypothesis Test: You want to test whether the proportion of crashes involving distracted drivers in Washington State is the same as the national average, to a significance level of 0.05. a. What should the null and alternative hypotheses look like? Ho: p = 0.06 HA: P = 0.06 ( Ho: μ = 25 Η Α: μ + 25 Ho: P1 = 0 HA: B1 0 b. Calculate the value of the point estimate. c. Does this pass the success-failure condition? Yes, this test passes the success-failure condition. No, this test does not pass the success-failure condition. d. Compute the standard error. e. Compute the test statistic. f. What is the p-value? g. What conclusion should we draw regarding H? O Fail to reject H O Reject H
The Department of Transportation reports that out of all fatal crashes, 6% of the drivers were distracted at the time of the crash. You take a sample of 345 fatal crashes in Washington State and find that 25 of the drivers were distracted. Hypothesis Test: You want to test whether the proportion of crashes involving distracted drivers in Washington State is the same as the national average, to a significance level of 0.05. a. What should the null and alternative hypotheses look like? Ho: p = 0.06 HA: P = 0.06 ( Ho: μ = 25 Η Α: μ + 25 Ho: P1 = 0 HA: B1 0 b. Calculate the value of the point estimate. c. Does this pass the success-failure condition? Yes, this test passes the success-failure condition. No, this test does not pass the success-failure condition. d. Compute the standard error. e. Compute the test statistic. f. What is the p-value? g. What conclusion should we draw regarding H? O Fail to reject H O Reject H
Glencoe Algebra 1, Student Edition, 9780079039897, 0079039898, 2018
18th Edition
ISBN:9780079039897
Author:Carter
Publisher:Carter
Chapter10: Statistics
Section10.6: Summarizing Categorical Data
Problem 30PPS
Related questions
Question
how do i solve for parts A-G?

Transcribed Image Text:The Department of Transportation reports that out of all fatal crashes, 6% of the drivers were distracted at the
time of the crash. You take a sample of 345 fatal crashes in Washington State and find that 25 of the drivers
were distracted.
Hypothesis Test: You want to test whether the proportion of crashes involving distracted drivers in Washington
State is the same as the national average, to a significance level of 0.05.
a. What should the null and alternative hypotheses look like?
Ho: p = 0.06
HA: P = 0.06
Ho: μ = 25
HA:
25
Ho: P1 = 0
HA: B1 0
b. Calculate the value of the point estimate.
c. Does this pass the success-failure condition?
Yes, this test passes the success-failure condition.
No, this test does not pass the success-failure condition.
d. Compute the standard error.
e. Compute the test statistic.
f. What is the p-value?
g. What conclusion should we draw regarding H?
Fail to reject H
Reject H
Expert Solution
This question has been solved!
Explore an expertly crafted, step-by-step solution for a thorough understanding of key concepts.
Step by step
Solved in 6 steps

Recommended textbooks for you

Glencoe Algebra 1, Student Edition, 9780079039897…
Algebra
ISBN:
9780079039897
Author:
Carter
Publisher:
McGraw Hill

College Algebra (MindTap Course List)
Algebra
ISBN:
9781305652231
Author:
R. David Gustafson, Jeff Hughes
Publisher:
Cengage Learning

Glencoe Algebra 1, Student Edition, 9780079039897…
Algebra
ISBN:
9780079039897
Author:
Carter
Publisher:
McGraw Hill

College Algebra (MindTap Course List)
Algebra
ISBN:
9781305652231
Author:
R. David Gustafson, Jeff Hughes
Publisher:
Cengage Learning