As a financial consultant you have customers with different investment risk preferences. You have a client who is interested in purchasing either AT&T stock or Google stock. This client, however, is risk adverse. Clients who are 'risk adverse' try to minimize their risk. To determine the relative risk/volatility between the 2 stock options, you use regression analysis to estimate the percent gain/loss of each stock as compared to the market: the S&P 500 percent gain/loss. The results of your regression models are given in the table below. Level of
As a financial consultant you have customers with different investment risk preferences. You have a client who is interested in purchasing either AT&T stock or Google stock. This client, however, is risk adverse. Clients who are 'risk adverse' try to minimize their risk. To determine the relative risk/volatility between the 2 stock options, you use regression analysis to estimate the percent gain/loss of each stock as compared to the market: the S&P 500 percent gain/loss. The results of your regression models are given in the table below. Level of

Functions and Change: A Modeling Approach to College Algebra (MindTap Course List)
6th Edition
ISBN:9781337111348
Author:Bruce Crauder, Benny Evans, Alan Noell
Publisher:Bruce Crauder, Benny Evans, Alan Noell
Chapter3: Straight Lines And Linear Functions
Section3.CR: Chapter Review Exercises
Problem 15CR: Life Expectancy The following table shows the average life expectancy, in years, of a child born in...

Related questions
Question
Please help me this question.
Transcribed Image Text:e File Preview
ZOOM
+
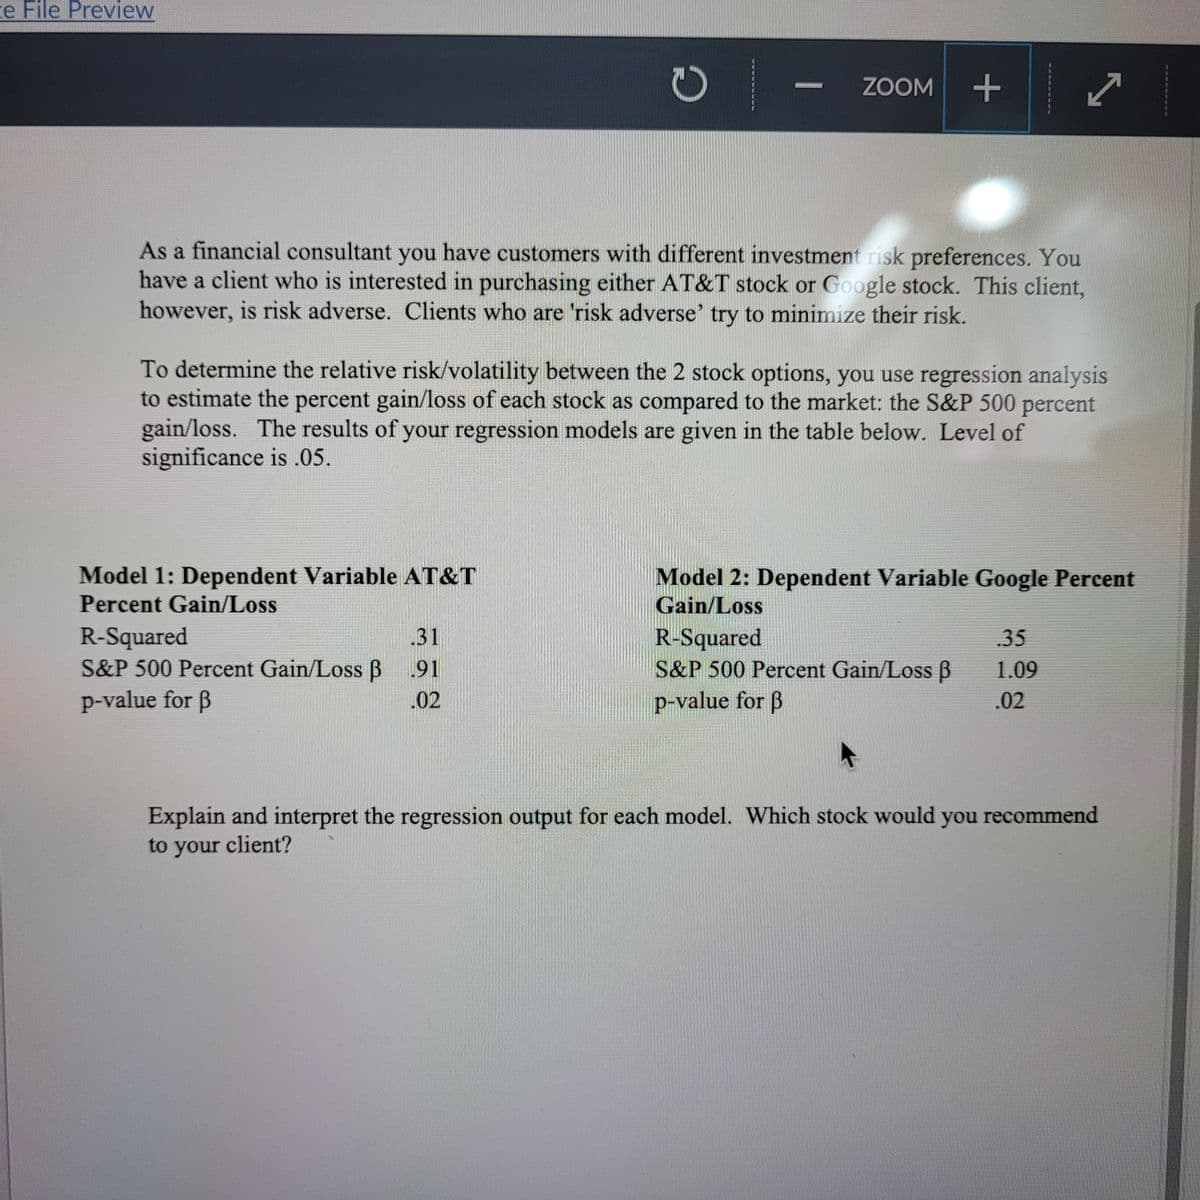
As a financial consultant you have customers with different investment risk preferences. You
have a client who is interested in purchasing either AT&T stock or Google stock. This client,
however, is risk adverse. Clients who are 'risk adverse' try to minimize their risk.
To determine the relative risk/volatility between the 2 stock options, you use regression analysis
to estimate the percent gain/loss of each stock as compared to the market: the S&P 500 percent
gain/loss. The results of your regression models are given in the table below. Level of
significance is .05.
Model 1: Dependent Variable AT&T
Model 2: Dependent Variable Google Percent
Gain/Loss
Percent Gain/Loss
R-Squared
S&P 500 Percent Gain/Loss B 91
31
R-Squared
S&P 500 Percent Gain/Loss B
p-value for ß
.35
1.09
p-value for B
.02
.02
Explain and interpret the regression output for each model. Which stock would you recommend
to your client?
2AHLCLH C - -
Expert Solution
This question has been solved!
Explore an expertly crafted, step-by-step solution for a thorough understanding of key concepts.

Step by step
Solved in 2 steps

Recommended textbooks for you
Functions and Change: A Modeling Approach to Coll…
Algebra
ISBN:
9781337111348
Author:
Bruce Crauder, Benny Evans, Alan Noell
Publisher:
Cengage Learning

Algebra and Trigonometry (MindTap Course List)
Algebra
ISBN:
9781305071742
Author:
James Stewart, Lothar Redlin, Saleem Watson
Publisher:
Cengage Learning

Functions and Change: A Modeling Approach to Coll…
Algebra
ISBN:
9781337111348
Author:
Bruce Crauder, Benny Evans, Alan Noell
Publisher:
Cengage Learning
Algebra and Trigonometry (MindTap Course List)
Algebra
ISBN:
9781305071742
Author:
James Stewart, Lothar Redlin, Saleem Watson
Publisher:
Cengage Learning

Glencoe Algebra 1, Student Edition, 9780079039897…
Algebra
ISBN:
9780079039897
Author:
Carter
Publisher:
McGraw Hill