Suppose the following data were collected from a sample of 15 CEOS relating annual salary to years of experience and the economic sector their company belongs to. Use statistical software to find the following regression equation: SALARY; = bo + b¡EXPERIENCE; + 62SERVICE; + B3INDUSTRIAL; + ej. Is there enough evidence to support the claim that on average, CEOS in the service sector have lower salaries than CEOS in the financial sector at the 0.05 level of significance? If yes, write the regression equation in the spaces provided with answers rounded to two decimal places. Else, select "There is not enough evidence." Copy Data CEO Salaries Industrial (1 if industrial sector, 0 Service (1 if service sector, 0 otherwise) Financial (1 if financial sector, 0 otherwise) Salary Experience otherwise) 170285 14 1 154013 19 1 159900 27 1 137750 1 165537 27 1 214560 32 1 167438 31 1 204325 28 1 136200 4 1 134075 2 1 129850 3 1 158313 21
Suppose the following data were collected from a sample of 15 CEOS relating annual salary to years of experience and the economic sector their company belongs to. Use statistical software to find the following regression equation: SALARY; = bo + b¡EXPERIENCE; + 62SERVICE; + B3INDUSTRIAL; + ej. Is there enough evidence to support the claim that on average, CEOS in the service sector have lower salaries than CEOS in the financial sector at the 0.05 level of significance? If yes, write the regression equation in the spaces provided with answers rounded to two decimal places. Else, select "There is not enough evidence." Copy Data CEO Salaries Industrial (1 if industrial sector, 0 Service (1 if service sector, 0 otherwise) Financial (1 if financial sector, 0 otherwise) Salary Experience otherwise) 170285 14 1 154013 19 1 159900 27 1 137750 1 165537 27 1 214560 32 1 167438 31 1 204325 28 1 136200 4 1 134075 2 1 129850 3 1 158313 21

College Algebra
7th Edition
ISBN:9781305115545
Author:James Stewart, Lothar Redlin, Saleem Watson
Publisher:James Stewart, Lothar Redlin, Saleem Watson
Chapter1: Equations And Graphs
Section: Chapter Questions
Problem 10T: Olympic Pole Vault The graph in Figure 7 indicates that in recent years the winning Olympic men’s...

Related questions
Question
Transcribed Image Text:181986
19
1
150000
16
1
175000
16
1
nswerHow to enter your answer (opens in new window)
E Tables
Кeypad
Keyboard Shortcuts
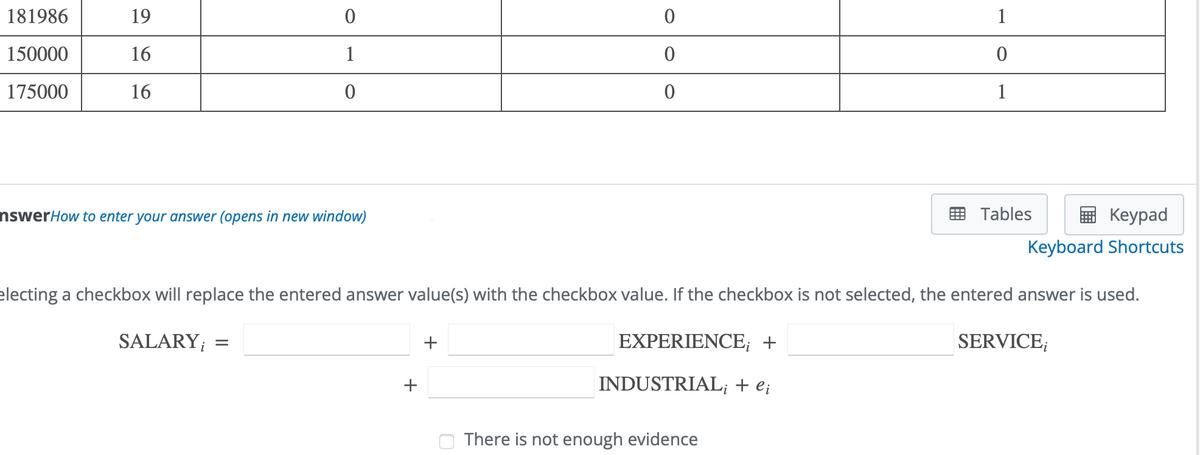
electing a checkbox will replace the entered answer value(s) with the checkbox value. If the checkbox is not selected, the entered answer is used.
SALARY;
+
EXPERIENCE; +
SERVICE;
INDUSTRIAL; + e;
There is not enough evidence
+
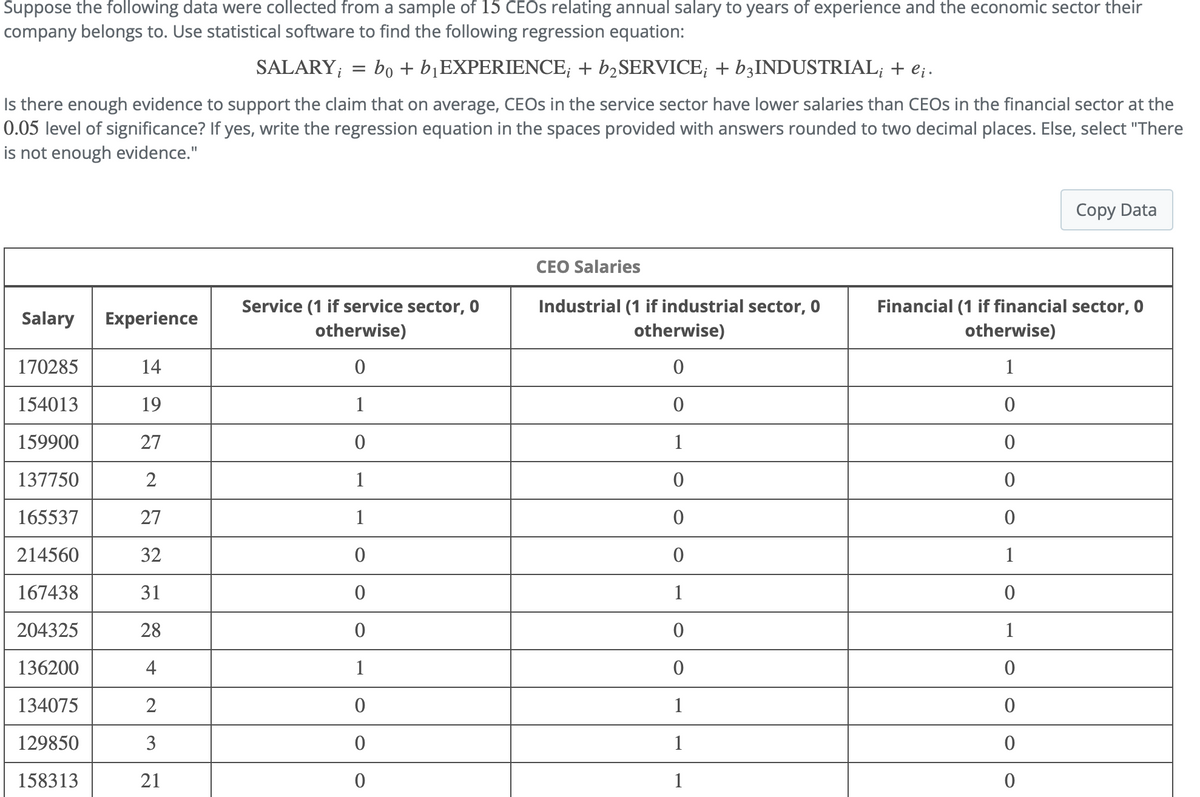
Transcribed Image Text:Suppose the following data were collected from a sample of 15 CEOS relating annual salary to years of experience and the economic sector their
company belongs to. Use statistical software to find the following regression equation:
SALARY; = bo + b¡EXPERIENCE; + b½SERVICE; + B3INDUSTRIAL; + e;.
Is there enough evidence to support the claim that on average, CEOS in the service sector have lower salaries than CEOS in the financial sector at the
0.05 level of significance? If yes, write the regression equation in the spaces provided with answers rounded to two decimal places. Else, select "There
is not enough evidence."
Copy Data
CEO Salaries
Service (1 if service sector, O
Industrial (1 if industrial sector, 0
Financial (1 if financial sector, 0
Salary
Experience
otherwise)
otherwise)
otherwise)
170285
14
1
154013
19
1
159900
27
1
137750
2
1
165537
27
1
214560
32
1
167438
31
1
204325
28
1
136200
4
1
134075
2
1
129850
3
158313
21
1
Expert Solution
This question has been solved!
Explore an expertly crafted, step-by-step solution for a thorough understanding of key concepts.

This is a popular solution!

Trending now
This is a popular solution!

Step by step
Solved in 2 steps with 2 images

Recommended textbooks for you
College Algebra
Algebra
ISBN:
9781305115545
Author:
James Stewart, Lothar Redlin, Saleem Watson
Publisher:
Cengage Learning

Linear Algebra: A Modern Introduction
Algebra
ISBN:
9781285463247
Author:
David Poole
Publisher:
Cengage Learning

Glencoe Algebra 1, Student Edition, 9780079039897…
Algebra
ISBN:
9780079039897
Author:
Carter
Publisher:
McGraw Hill
College Algebra
Algebra
ISBN:
9781305115545
Author:
James Stewart, Lothar Redlin, Saleem Watson
Publisher:
Cengage Learning
Linear Algebra: A Modern Introduction
Algebra
ISBN:
9781285463247
Author:
David Poole
Publisher:
Cengage Learning
Glencoe Algebra 1, Student Edition, 9780079039897…
Algebra
ISBN:
9780079039897
Author:
Carter
Publisher:
McGraw Hill