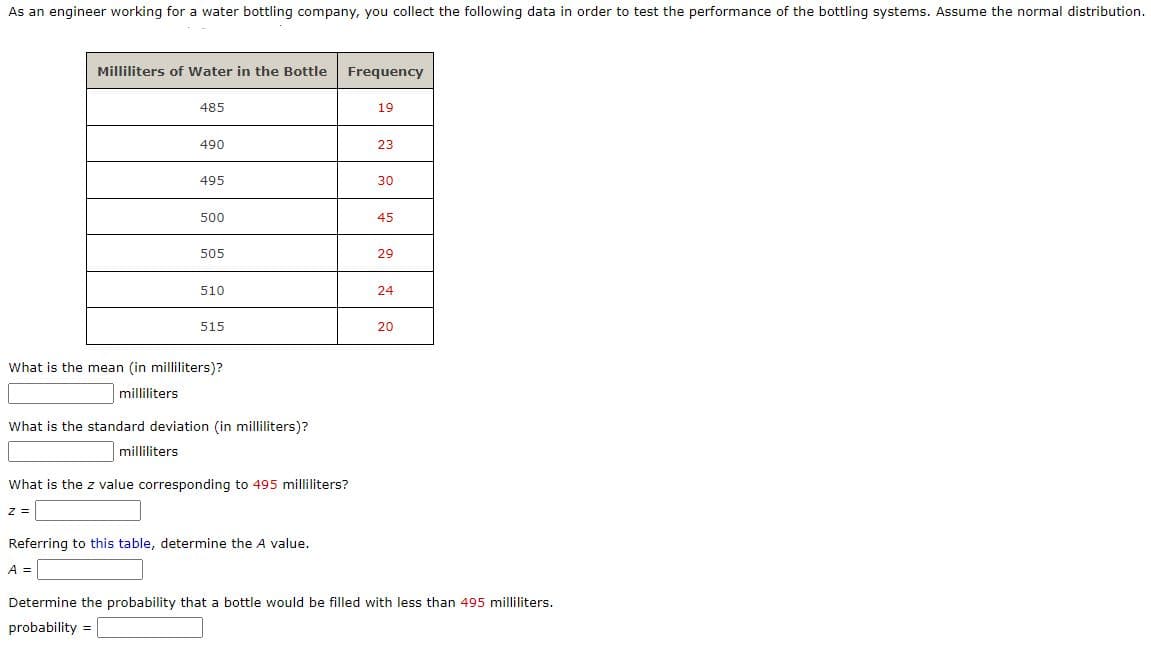
As an engineer working for a water bottling company, you collect the following data in order to test the performance of the bottling systems. Assume the normal distribution. Milliliters of Water in the Bottle Frequency 485 Z= 490 milliliters 495 500 505 510 What is the mean (in milliliters)? milliliters 515 What is the standard deviation (in milliliters)? What is the z value corresponding to 495 milliliters? Referring to this table, determine the A value. A = 19 23 30 45 29 24 20 Determine the probability that a bottle would be filled with less than 495 milliliters. probability =
As an engineer working for a water bottling company, you collect the following data in order to test the performance of the bottling systems. Assume the normal distribution. Milliliters of Water in the Bottle Frequency 485 Z= 490 milliliters 495 500 505 510 What is the mean (in milliliters)? milliliters 515 What is the standard deviation (in milliliters)? What is the z value corresponding to 495 milliliters? Referring to this table, determine the A value. A = 19 23 30 45 29 24 20 Determine the probability that a bottle would be filled with less than 495 milliliters. probability =

Principles of Heat Transfer (Activate Learning with these NEW titles from Engineering!)
8th Edition
ISBN:9781305387102
Author:Kreith, Frank; Manglik, Raj M.
Publisher:Kreith, Frank; Manglik, Raj M.
Chapter5: Analysis Of Convection Heat Transfer
Section: Chapter Questions
Problem 5.2P: 5.2 Evaluate the Prandtl number from the following data: , .

Related questions

Question
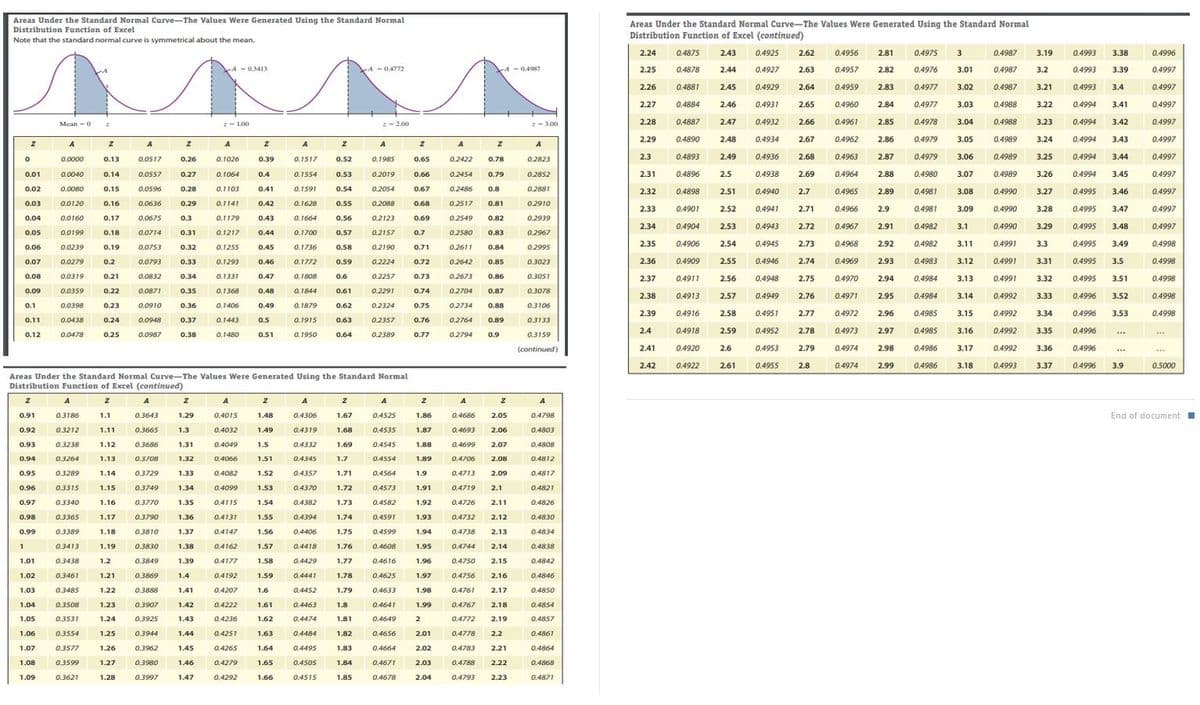
Transcribed Image Text:Areas Under the Standard Normal Curve-The Values Were Generated Using the Standard Normal
Distribution Function of Excel
Note that the standard normal curve is symmetrical about the mean.
z
0
0.01
0.02
0.03
0.04
0.05
0.06
0.07
0.08
0.09
0.1
0.11
0.12
1
0.95
0.96
0.97
0.98
0.99
1.01
1.02
1.03
1.04
1.05
Mean - 0
1.06
1.07
1.08
1.09
A
0.0000
0.0040
0.0080
0.0120
0.0160
0.0199
0.0239
0.0279
0.0319
0.0359
0.0398
0.0438
0.0478
A
0.3186
0.3212
0.3238
0.3264
0.3289
0.3315
0.3340
0.3365
0.3389
Z
0.3413
0.3438
0.3461
0.3485
0.3508
0.3531
0.3554
0.3577
0.3599
0.3621
0.13
0.14
0.15
0.16
0.17
0.18
0.19
0.2
0.21
0.22
0.23
0.24
0.25
1.12
1.13
1.14
1.15
1.16
1.17
A
z
0.0517
0.0557
0.26
0.27
0.28
0.29
0.0596
0.0636
0.0675 0.3
0.0714 0.31
0.0753 0.32
0.0793 0.33
0.0832 0.34
0.0871 0.35
0.0910
0.0948
0.0987
1.18
1.19
1.2
1.21
1.22
1.23
1.24
1.25
1.26
1.27
1.28
A
0.3643
0.3665
0.3686
0.3708
0.3729
0.3749
0.3770
0.3790
0.3810
0.36
0.3830
0.3849
0.3869
0.3888
0.3907
0.3925
0.3944
0.3962
0.3980
0.3997
0.37
0.38
z
1.29
1.3
1.31
1.32
1.33
1.34
1.35
A-03413
1.36
1.37
1.38
1.39
1.4
1.41
1.42
1.43
1.44
1.45
1.46
1.47
21.00
A
0.1026
0.1064
0.1103
Areas Under the Standard Normal Curve-The Values Were Generated Using the Standard Normal
Distribution Function of Excel (continued)
z
Z
0.91
0.92
0.93
1.1
1.11
0.94
0.1443
Z
0.44
0.1141
0.1179
0.1217
0.1255 0.45
0.1293 0.46
0.1331
0.47
0.1368 0.48
0.1406
0.49
0.5
0.51
0.1480
0.39
0.4
0.41
0.42
0.43
A
0.4015
0.4032
0.4049
0.4066
0.4082
0.4099
0.4115
0.4131
0.4147
0.4162
1.54
1.55
1.56
1.57
0.4177 1.58
0.4192 1.59
0.4207 1.6
0.4222 1.61
0.4236 1.62
0.4251 1.63
1.64
1.65
1.66
0.4265
0.4279
0.4292
z
1.48
1.49
1.5
1.51
1.52
A
0.1517
1.53
0.1554
0.1591
0.1628
0.1664
0,1700
0.1736
0.1772
0.1808
0.1844
0.1879
0.1915
0.1950
A
0.4306
0.4319
0.4332
0.4345
0.4357
0.4370
0.4382
0.4394
0.4406
0.4418
z
0.52
0.53
0.54
0.55
0.56
0.57
0.58
0.59
0.6
0.61
0.62
0.63
0.64
0.4429
0.4441
04452
0.4463
0.4474
0.4484
0.4495
0.4505
0.4515
z
1.67
1.68
1.69
1.7
1.71
1.72
1.73
1.74
1.75
1.76
1.77
1.78
1.79
1.8
A04772
1.81
1.82
1.83
1.84
1.85
z-2.00
Z
0.65
0.66
A
A
0.78
0.1985
0.2422
0.2019
0.2454 0.79
0.2054 0.67 0.2486 0.8
0.2088 0.68 0.2517
0.81
0.2123 0.69 0.2549 0.82
0.2157 0.7
0.2580 0.83
0.2190 0.71 0.2611 0.84
0.2224 0.72 0.2642 0.85
0.2257 0.73 0.2673 0.86
0.2291 0.74 0.2704 0.87
0.2324 0.75 0.2734 0.88
0.2357 0.76 0.2764
0.89
0.2389 0.77 0.2794 0.9
A
0.4525
0.4535
0.4545
0.4554
0.4564
0.4573
0.4582
0.4591
0.4599
0.4608
0.4616
0.4625
0.4633
0.4641
0.4649
0.4656
0.4664
0.4671
0.4678
z
1.86
1.87
1.88
1.89
1.9
1.91
1.92
1.93
1.94
1.95
1.96
1.97
1.98
1.99
2
Z
2.01
2.02
2.03
2.04
A-0.4987
A
z
0.4686 2.05
0.4693 2.06
0.4699
0.4706
2.08
0.4713 2.09
0.4719
2.1
0.4726 2.11
0.4732 2.12
0.4738 2.13
0.4744 2.14
0.4750 2.15
2.16
0.4756
0.4761 2.17
0.4767
2.18
0.4772 2.19
0.4778 2.2
0.4783 2.21
0.4788
0.4793
2.07
2.22
2.23
-3.00
A
0.2823
0.2852
0.2881
0.2910
0.2939
0.2967
0.2995
0.3023
0.3051
0.3078
0.3106
0.3133
0.3159
(continued)
A
0.4798
0.4803
0.4808
0.4812
0.4817
0.4821
0.4826
0.4830
0.4834
0.4838
0.4842
0.4846
0.4850
0.4854
0.4857
0.4861
0.4864
0.4868
0.4871
Areas Under the Standard Normal Curve-The Values Were Generated Using the Standard Normal
Distribution Function of Excel (continued)
2,24
2.26
2.27
2.28
0.4875 2.43 0.4925 2.62
0.4878 2.44 0.4927 2.63
0.4881 2.45 0.4929 2.64
0.4884 2.46 0.4931 2.65
0.4887 2.47
2.66
2.29 0.4890
2.48 0.4934 2.67
2.49
2.3 0.4893
0.4936
2.31 0.4896 2.5 0.4938 2.69
0.4898 2.51 0.4940 2.7
0.4901 2.52 0,4941 2.71
0.4904 2.53 0.4943 2.72
2.54 0.4945 2.73
0.4906
0.4909
2.55
0.4946 2.74
0.4911 2.56 0.4948 2.75
0.4913 2.57 0.4949 2.76
0.4916 2.58 0.4951 2.77
0.4918
0.4920 2.6 0.4953
0.4922 2.61 0.4955
2.78
2.79
2.25
2.32
2.33
2.34
2.35
2.36
2.37
2.38
2.39
2.4
2.41
2.42
2.59
0.4932
0.4952
2.68
2.8
2.81 0.4975 3
0.4987 3.19
2.82 0.4976 3.01 0.4987 3.2
2.83 0.4977 3.02 0.4987 3.21
0.4977 3.03 0.4988 3.22
2.85 0.4978 3.04 0.4988 3.23
2.86 0.4979 3.05 0.4989
2.87
0.4979
3.06
2.88
3.07
2.89 0.4981 3.08
0.4981 3.09
0.4982
0.4980
0.4956
0.4957
0.4959
0.4960
0.4961
0.4962
0.4963
0.4964
0.4965
0.4966
0.4967 2.91
0.4968 2.92
0.4969 2.93
0.4970
2.94
0.4971 2.95
0.4972 2.96
0.4973 2.97
0.4974 2.98
0.4974 2.99
2.84
2.9
0.4982
0.4983
3.1
3.11
3.12
3.13
0.4984
0.4984 3.14
0.4985 3.15
0.4985
0.4986 3.17
0.4986
3.16
0.4993 3.38
0.4993 3.39
0.4993 3.4
3.41
0.4994 3.42
0.4994 3.43
0.4994
3.25
3.44
0.4989 3.26 0.4994 3.45
0.4990 3.27
0.4990
3.18
0.4989
0.4990
0.4991
3.24
3.28
3.29
3.3
0.4991 3.31
0.4991 3.32
0.4992 3.33
0.4992 3.34
0.4992 3.35
0.4992 3.36
0.4993 3.37
0.4994
0.4995 3.46
0.4995 3.47
0.4995 3.48
0.4995 3.49
0.4995 3.5
0.4995 3.51
0.4996 3.52
0.4996 3.53
0.4996
0.4996
0.4996
***
***
3.9
0.4996
0.4997
0.4997
0.4997
0.4997
0.4997
0.4997
0.4997
0.4997
0.4997
0.4997
0.4998
0.4998
0.4998
0.4998
0.4998
c...
***
0.5000
End of document
Transcribed Image Text:As an engineer working for a water bottling company, you collect the following data in order to test the performance of the bottling systems. Assume the normal distribution.
Milliliters of Water in the Bottle
485
490
milliliters
495
500
505
510
515
What is the mean (in milliliters)?
milliliters
What is the standard deviation (in milliliters)?
Frequency
What is the z value corresponding to 495 milliliters?
Z =
Referring to this table, determine the A value.
A =
19
23
30
45
29
24
20
Determine the probability that a bottle would be filled with less than 495 milliliters.
probability=
Expert Solution
This question has been solved!
Explore an expertly crafted, step-by-step solution for a thorough understanding of key concepts.

Step by step
Solved in 6 steps with 1 images

Knowledge Booster


Learn more about
Need a deep-dive on the concept behind this application? Look no further. Learn more about this topic, mechanical-engineering and related others by exploring similar questions and additional content below.Recommended textbooks for you
Principles of Heat Transfer (Activate Learning wi…
Mechanical Engineering
ISBN:
9781305387102
Author:
Kreith, Frank; Manglik, Raj M.
Publisher:
Cengage Learning
Principles of Heat Transfer (Activate Learning wi…
Mechanical Engineering
ISBN:
9781305387102
Author:
Kreith, Frank; Manglik, Raj M.
Publisher:
Cengage Learning