As part of the United States Department of Agriculture's Super Dump Cleanup in the early 2000s, various sites in the country were targeted for cleanup. Three of the targeted sites - River X, River Y, and River Z - had become contaminated with pesticides because they were located near abandoned pesticide dump sites. Measurements of the concentration of aldrin (a commonly used pesticide) were taken at twenty randomly selected locations in each river near the dump sites. The boxplots shown below display the five-number summaries for the concentrations, in parts per million (ppm) of aldrin, for the twenty locations that were sampled in each of the three rivers. River X River Y River Z 3.4 3 8.6 (a) Compare the distributions of concentration of aldrin among the three rivers. Use your SOCS. (b) The twenty concentrations of aldrin for River X are given below. 4.0 5.6 5.1 8.7 4 7 Concentrations of Aldrin (ppm) 8 River X Aldrin Concentration Data 3.7 8.0 5.5 5.3 4.2 4.3 7.3 7.5 5.3 8.2 4.7 4.8 4.6 4.6 Construct a stemplot that displays the concentrations of aldrin for River X. (c) Describe a characteristic of the distribution of aldrin concentrations in River X that can be seen in the stemplot but cannot be seen in the boxplot.
As part of the United States Department of Agriculture's Super Dump Cleanup in the early 2000s, various sites in the country were targeted for cleanup. Three of the targeted sites - River X, River Y, and River Z - had become contaminated with pesticides because they were located near abandoned pesticide dump sites. Measurements of the concentration of aldrin (a commonly used pesticide) were taken at twenty randomly selected locations in each river near the dump sites. The boxplots shown below display the five-number summaries for the concentrations, in parts per million (ppm) of aldrin, for the twenty locations that were sampled in each of the three rivers. River X River Y River Z 3.4 3 8.6 (a) Compare the distributions of concentration of aldrin among the three rivers. Use your SOCS. (b) The twenty concentrations of aldrin for River X are given below. 4.0 5.6 5.1 8.7 4 7 Concentrations of Aldrin (ppm) 8 River X Aldrin Concentration Data 3.7 8.0 5.5 5.3 4.2 4.3 7.3 7.5 5.3 8.2 4.7 4.8 4.6 4.6 Construct a stemplot that displays the concentrations of aldrin for River X. (c) Describe a characteristic of the distribution of aldrin concentrations in River X that can be seen in the stemplot but cannot be seen in the boxplot.

Glencoe Algebra 1, Student Edition, 9780079039897, 0079039898, 2018
18th Edition
ISBN:9780079039897
Author:Carter
Publisher:Carter
Chapter10: Statistics
Section10.1: Measures Of Center
Problem 9PPS

Related questions
Question
Transcribed Image Text:As part of the United States Department of Agriculture's Super Dump Cleanup in the early 2000s,
various sites in the country were targeted for cleanup. Three of the targeted sites - River X, River Y,
and River Z - had become contaminated with pesticides because they were located near abandoned
pesticide dump sites. Measurements of the concentration of aldrin (a commonly used pesticide) were
taken at twenty randomly selected locations in each river near the dump sites.
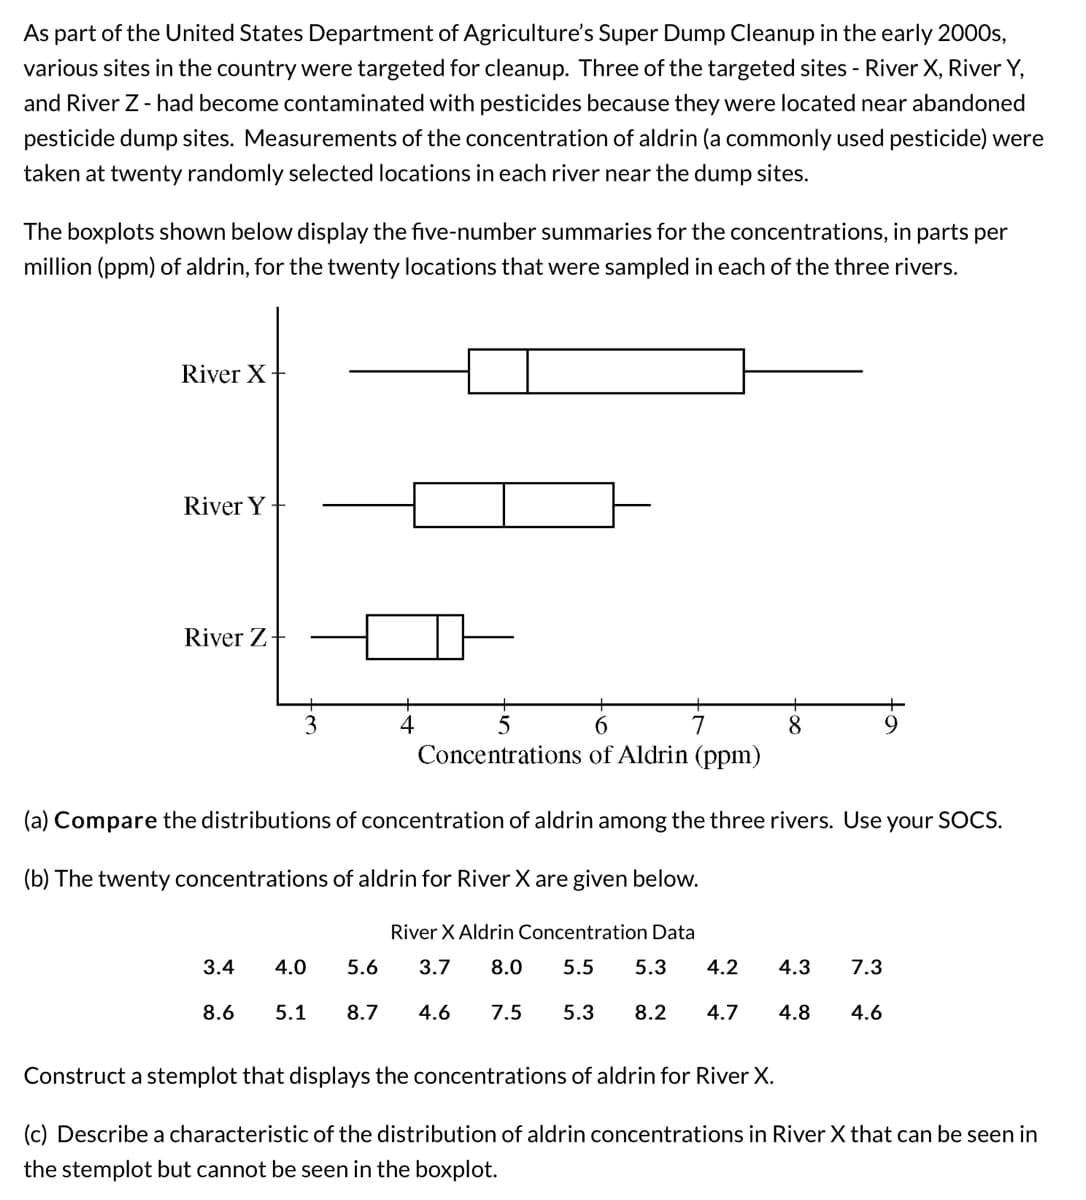
The boxplots shown below display the five-number summaries for the concentrations, in parts per
million (ppm) of aldrin, for the twenty locations that were sampled in each of the three rivers.
River X
River Y
River Z+
3.4
(a) Compare the distributions of concentration of aldrin among the three rivers. Use your SOCS.
(b) The twenty concentrations of aldrin for River X are given below.
4.0
5.6
5
6
7
Concentrations of Aldrin (ppm)
8.6 5.1 8.7
River X Aldrin Concentration Data
3.7 8.0 5.5 5.3
8
4.6
4.2 4.3 7.3
7.5 5.3 8.2 4.7 4.8
4.6
Construct a stemplot that displays the concentrations of aldrin for River X.
(c) Describe a characteristic of the distribution of aldrin concentrations in River X that can be seen in
the stemplot but cannot be seen in the boxplot.
Expert Solution
This question has been solved!
Explore an expertly crafted, step-by-step solution for a thorough understanding of key concepts.

This is a popular solution!

Trending now
This is a popular solution!

Step by step
Solved in 3 steps

Recommended textbooks for you
Glencoe Algebra 1, Student Edition, 9780079039897…
Algebra
ISBN:
9780079039897
Author:
Carter
Publisher:
McGraw Hill
Glencoe Algebra 1, Student Edition, 9780079039897…
Algebra
ISBN:
9780079039897
Author:
Carter
Publisher:
McGraw Hill