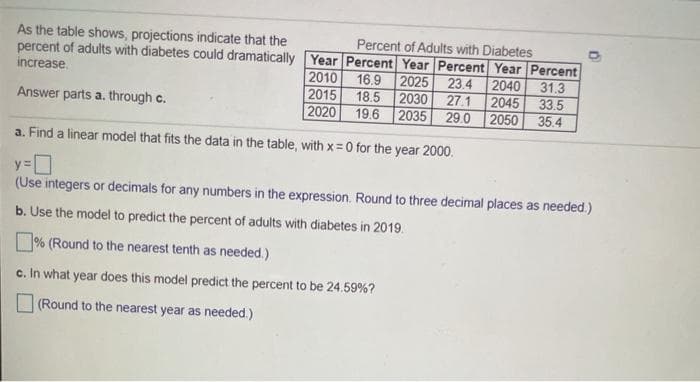
As the table shows, projections indicate that the Percent of Adults with Diabetes percent of adults with diabetes could dramatically Year Percent Year Percent Year Percent 2010 2015 2020 increase. 16.9 2025 23.4 2040 2045 2050 31.3 33.5 18.5 2030 27.1 Answer parts a. through c. 2035 29.0 19.6 35.4 a. Find a linear model that fits the data in the table, with x=0 for the year 2000. (Use integers or decimals for any numbers in the expression. Round to three decimal places as needed.) b. Use the model to predict the percent of adults with diabetes in 2019. % (Round to the nearest tenth as needed.) c. In what year does this model predict the percent to be 24.59%? O (Round to the nearest year as needed)


Correlation
Correlation defines a relationship between two independent variables. It tells the degree to which variables move in relation to each other. When two sets of data are related to each other, there is a correlation between them.
Linear Correlation
A correlation is used to determine the relationships between numerical and categorical variables. In other words, it is an indicator of how things are connected to one another. The correlation analysis is the study of how variables are related.
Regression Analysis
Regression analysis is a statistical method in which it estimates the relationship between a dependent variable and one or more independent variable. In simple terms dependent variable is called as outcome variable and independent variable is called as predictors. Regression analysis is one of the methods to find the trends in data. The independent variable used in Regression analysis is named Predictor variable. It offers data of an associated dependent variable regarding a particular outcome.


Trending now
This is a popular solution!

Step by step
Solved in 4 steps with 1 images


