The following table shows retail sales in drug stores in billions of dollars in the U.S. for years since 1995. Year Retail Sales 0 3 6 9 220 210- 200- 190- 180- 170- 160- 150- 140- 130- 120- 110- 100 12 15 Let y be the retails sales in billions of dollars in a years since 1995. A linear model for the data is y 9.44x + 84.182. 90- 804 85.851 108.426 141.781 169.256 202.297 222.266 3 6 9 12 15 A) Use the above scatter plot to decide whether the line of best fit, fits the data well. The function is not a good model for the data The function is a good model for the data.
The following table shows retail sales in drug stores in billions of dollars in the U.S. for years since 1995. Year Retail Sales 0 3 6 9 220 210- 200- 190- 180- 170- 160- 150- 140- 130- 120- 110- 100 12 15 Let y be the retails sales in billions of dollars in a years since 1995. A linear model for the data is y 9.44x + 84.182. 90- 804 85.851 108.426 141.781 169.256 202.297 222.266 3 6 9 12 15 A) Use the above scatter plot to decide whether the line of best fit, fits the data well. The function is not a good model for the data The function is a good model for the data.

Chapter3: Polynomial Functions
Section3.5: Mathematical Modeling And Variation
Problem 1ECP: The ordered pairs below give the median sales prices y (in thousands of dollars) of new homes sold...

Related questions
Question
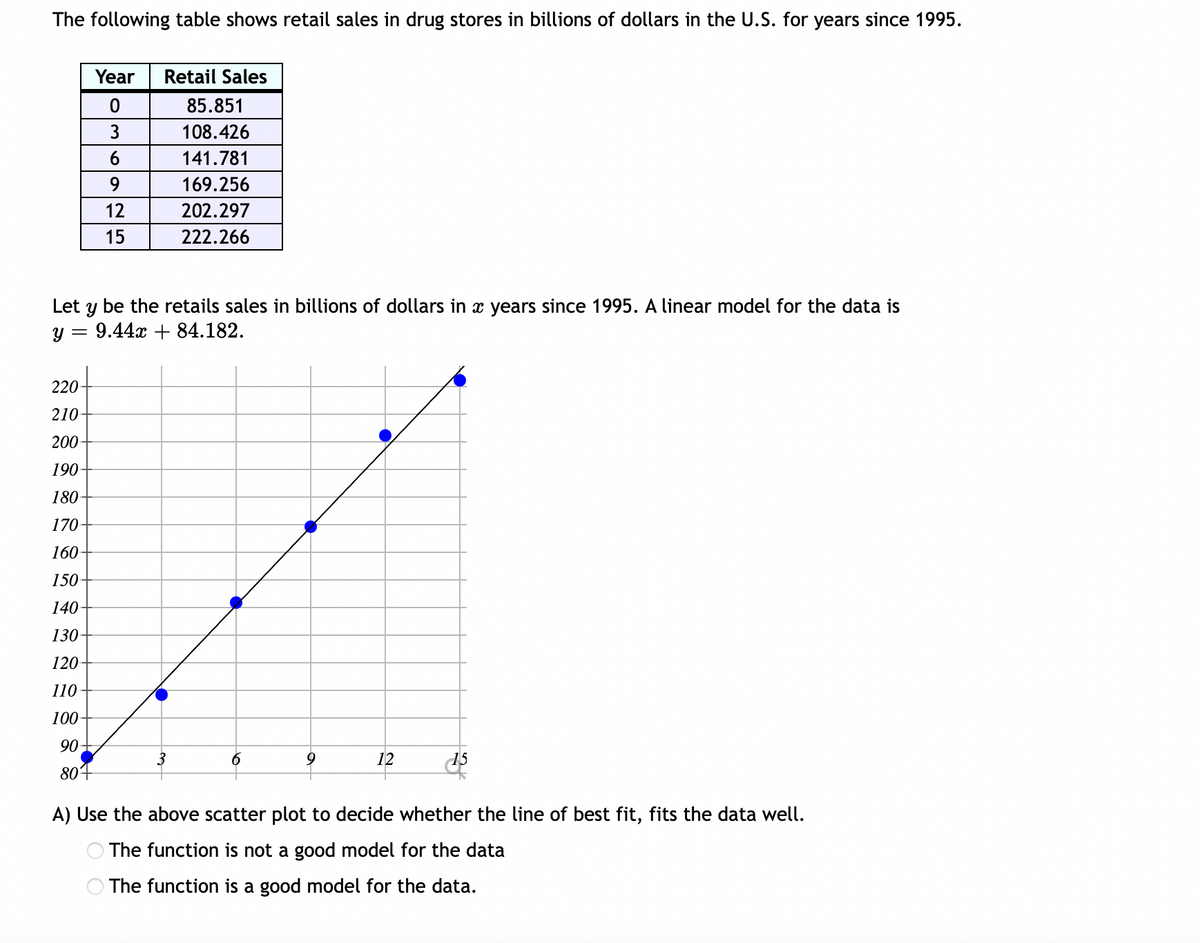
Transcribed Image Text:The following table shows retail sales in drug stores in billions of dollars in the U.S. for years since 1995.
Year Retail Sales
0
3
6
220-
210-
200
190-
180-
170-
160-
150-
140-
130-
120-
110
100-
90-
804
9
12
15
Let y be the retails sales in billions of dollars in x years since 1995. A linear model for the data is
y = 9.44x + 84.182.
85.851
108.426
141.781
169.256
202.297
222.266
3
6
9
12
15
A) Use the above scatter plot to decide whether the line of best fit, fits the data well.
The function is not a good model for the data
The function is a good model for the data.
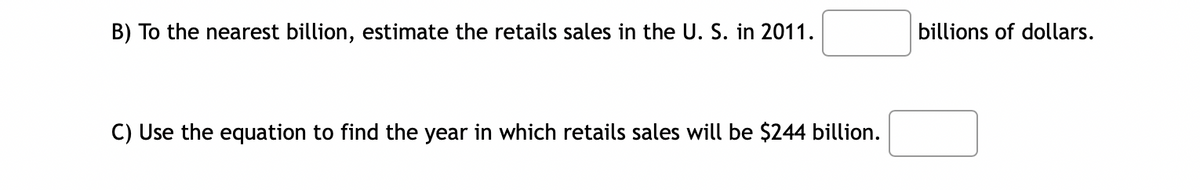
Transcribed Image Text:B) To the nearest billion, estimate the retails sales in the U. S. in 2011.
C) Use the equation to find the year in which retails sales will be $244 billion.
billions of dollars.
Expert Solution
This question has been solved!
Explore an expertly crafted, step-by-step solution for a thorough understanding of key concepts.

This is a popular solution!

Trending now
This is a popular solution!

Step by step
Solved in 2 steps with 1 images

Recommended textbooks for you

Algebra & Trigonometry with Analytic Geometry
Algebra
ISBN:
9781133382119
Author:
Swokowski
Publisher:
Cengage

Algebra & Trigonometry with Analytic Geometry
Algebra
ISBN:
9781133382119
Author:
Swokowski
Publisher:
Cengage

Functions and Change: A Modeling Approach to Coll…
Algebra
ISBN:
9781337111348
Author:
Bruce Crauder, Benny Evans, Alan Noell
Publisher:
Cengage Learning