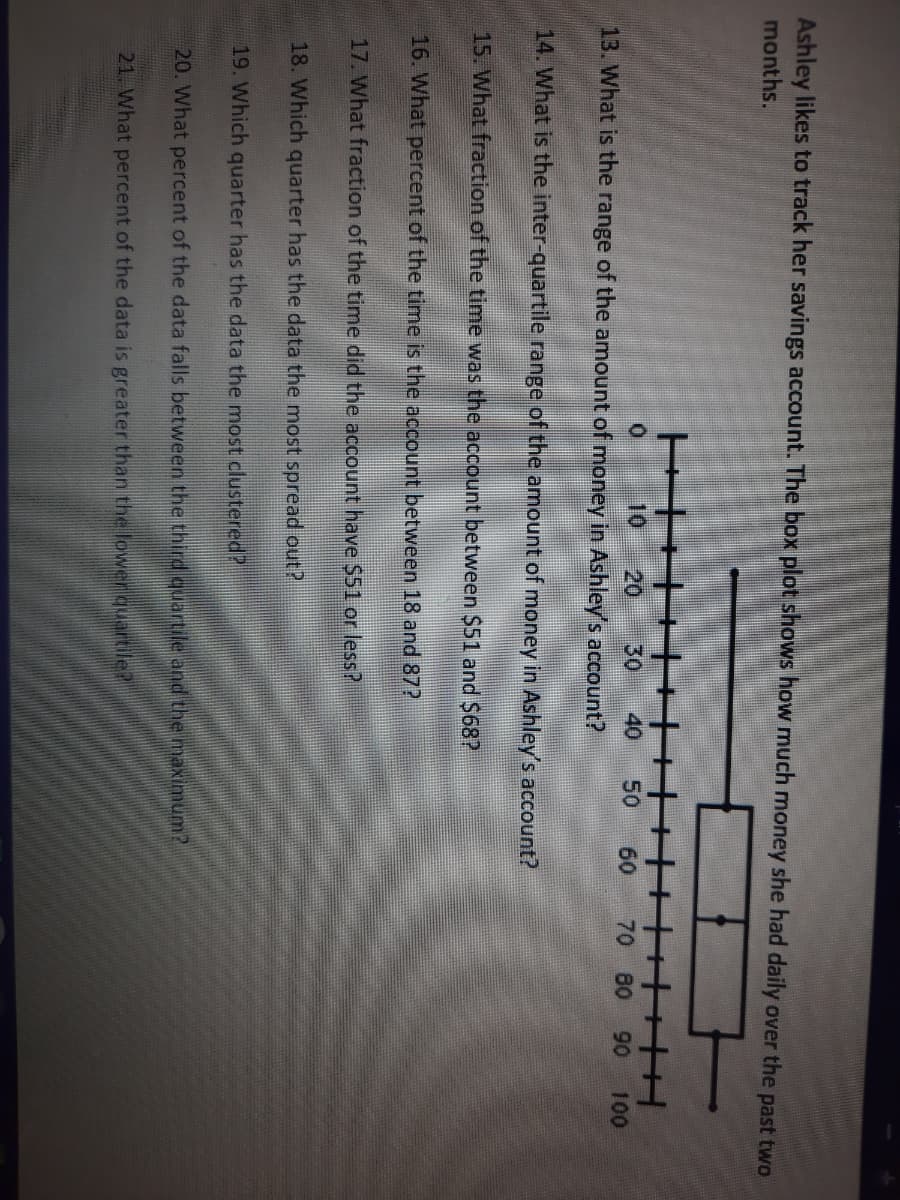
Ashley likes to track her savings account. The box plot shows how much money she had daily over the past two months. 10 20 30 40 50 60 70 80 90 100 13. What is the range of the amount of money in Ashley's account? 14. What is the inter-quartile range of the amount of money in Ashley's account? 15. What fraction of the time was the account between $51 and $68?

College Algebra
1st Edition
ISBN:9781938168383
Author:Jay Abramson
Publisher:Jay Abramson
Chapter9: Sequences, Probability And Counting Theory
Section9.7: Probability
Problem 57SE: Use this data for the exercises that follow: In 2013, there were roughly 317 million citizens in the...
icon
Related questions
icon
Concept explainers
Topic Video
Question
Help me asap
Ashley likes to track her savings account. The box plot shows how much money she had daily over the past two
months.
30
13. What is the range of the amount of money in Ashley's account?
10
20
40
50
60
70 80
90
100
14. What is the inter-quartile range of the amount of money in Ashley's account?
15. What fraction of the time was the account between $51 and $68?
16. What percent of the time is the account between 18 and 87?
17. What fraction of the time did the account have $51 or less?
18. Which quarter has the data the most spread out?
19. Which quarter has the data the most clustered?
20. What percent of the data falls between the third quartile and the maximum?
21. What percent of the data is greater than the lowerrquartile?
Transcribed Image Text:Ashley likes to track her savings account. The box plot shows how much money she had daily over the past two months. 30 13. What is the range of the amount of money in Ashley's account? 10 20 40 50 60 70 80 90 100 14. What is the inter-quartile range of the amount of money in Ashley's account? 15. What fraction of the time was the account between $51 and $68? 16. What percent of the time is the account between 18 and 87? 17. What fraction of the time did the account have $51 or less? 18. Which quarter has the data the most spread out? 19. Which quarter has the data the most clustered? 20. What percent of the data falls between the third quartile and the maximum? 21. What percent of the data is greater than the lowerrquartile?
Expert Solution
steps

Step by step

Solved in 2 steps with 2 images

Blurred answer
Knowledge Booster
Angles, Arcs, and Chords and Tangents
Learn more about
Need a deep-dive on the concept behind this application? Look no further. Learn more about this topic, statistics and related others by exploring similar questions and additional content below.
Recommended textbooks for you
College Algebra
College Algebra
Algebra
ISBN:
9781938168383
Author:
Jay Abramson
Publisher:
OpenStax
Holt Mcdougal Larson Pre-algebra: Student Edition…
Algebra
ISBN:
9780547587776
Author:
HOLT MCDOUGAL
Publisher:
HOLT MCDOUGAL
Glencoe Algebra 1, Student Edition, 9780079039897…
Algebra
ISBN:
9780079039897
Author:
Carter
Publisher:
McGraw Hill
Big Ideas Math A Bridge To Success Algebra 1: Stu…
Algebra
ISBN:
9781680331141
Author:
HOUGHTON MIFFLIN HARCOURT
Publisher:
Houghton Mifflin Harcourt
Algebra: Structure And Method, Book 1
Algebra
ISBN:
9780395977224
Author:
Richard G. Brown, Mary P. Dolciani, Robert H. Sorgenfrey, William L. Cole
Publisher:
McDougal Littell
Elementary Algebra
Elementary Algebra
Algebra
ISBN:
9780998625713
Author:
Lynn Marecek, MaryAnne Anthony-Smith
Publisher:
OpenStax - Rice University