Assets Current Assets Cash On The Dot Trading Statement of Financial Position As of December 31 Short-term Investments Accounts Receivable, Net Merchandise Inventory Total Current Assets Property, Plant, and Equipment (net) Total Assets Liabilities and Owner's Equity Current Liabilities Non-Current Liabilities Total Liabilities Owner's Equity Total Liabilities and Owner's Equity 2017 158,000 130,000 240,000 500,000 2016 84,000 192,000 200,000 530,000 P1,028,000 P1,006,000 2,340,000 3,368,000 2,350,000 3,356,000 P 530,000 800,000 P1,330,000 P1,424,000 2,038,000 P3,368,000 584,000 840,000 1,932,000 3,356,000
Assets Current Assets Cash On The Dot Trading Statement of Financial Position As of December 31 Short-term Investments Accounts Receivable, Net Merchandise Inventory Total Current Assets Property, Plant, and Equipment (net) Total Assets Liabilities and Owner's Equity Current Liabilities Non-Current Liabilities Total Liabilities Owner's Equity Total Liabilities and Owner's Equity 2017 158,000 130,000 240,000 500,000 2016 84,000 192,000 200,000 530,000 P1,028,000 P1,006,000 2,340,000 3,368,000 2,350,000 3,356,000 P 530,000 800,000 P1,330,000 P1,424,000 2,038,000 P3,368,000 584,000 840,000 1,932,000 3,356,000

Financial Accounting
14th Edition
ISBN:9781305088436
Author:Carl Warren, Jim Reeve, Jonathan Duchac
Publisher:Carl Warren, Jim Reeve, Jonathan Duchac
Chapter17: Financial Statement Analysis
Section: Chapter Questions
Problem 17E

Related questions
Question
Perform a vertical analysis.
Transcribed Image Text:72
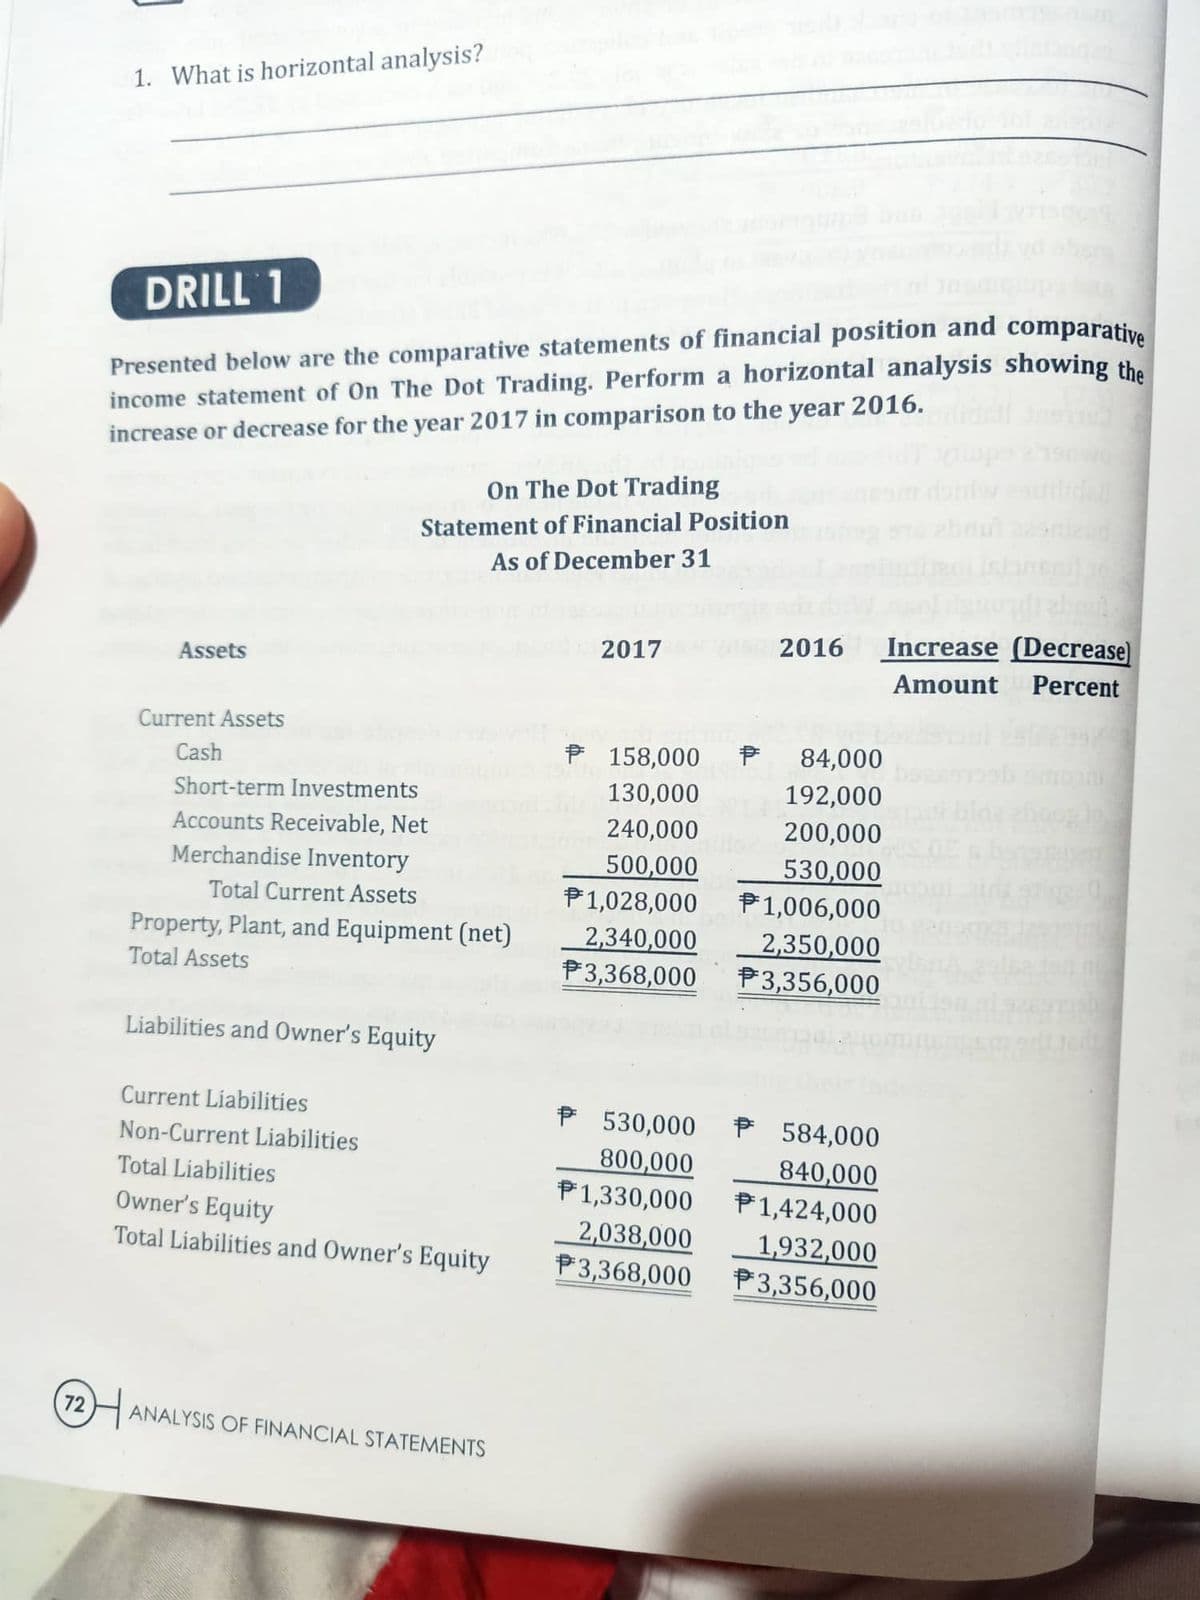
1. What is horizontal analysis?
DRILL 1
Presented below are the comparative statements of financial position and comparative
income statement of On The Dot Trading. Perform a horizontal analysis showing the
increase or decrease for the year 2017 in comparison to the year 2016.
Assets
Current Assets
Cash
On The Dot Trading
Statement of Financial Position
As of December 31
Short-term Investments
Accounts Receivable, Net
Merchandise Inventory
Total Current Assets
Property, Plant, and Equipment (net)
Total Assets
Liabilities and Owner's Equity
Current Liabilities
Non-Current Liabilities
Total Liabilities
Owner's Equity
Total Liabilities and Owner's Equity
ANALYSIS OF FINANCIAL STATEMENTS
2017
158,000 P
130,000
240,000
500,000
1,028,000
2,340,000
$3,368,000
2016
84,000
192,000
200,000
530,000
1,006,000
2,350,000
3,356,000
P 530,000
800,000
P1,330,000 P1,424,000
2,038,000
1,932,000
3,368,000 P3,356,000
P 584,000
840,000
296
Increase (Decrease)
Amount Percent
Expert Solution
This question has been solved!
Explore an expertly crafted, step-by-step solution for a thorough understanding of key concepts.

Step by step
Solved in 3 steps

Knowledge Booster


Learn more about
Need a deep-dive on the concept behind this application? Look no further. Learn more about this topic, accounting and related others by exploring similar questions and additional content below.Recommended textbooks for you
Financial Accounting
Accounting
ISBN:
9781305088436
Author:
Carl Warren, Jim Reeve, Jonathan Duchac
Publisher:
Cengage Learning

Survey of Accounting (Accounting I)
Accounting
ISBN:
9781305961883
Author:
Carl Warren
Publisher:
Cengage Learning

Cornerstones of Financial Accounting
Accounting
ISBN:
9781337690881
Author:
Jay Rich, Jeff Jones
Publisher:
Cengage Learning
Financial Accounting
Accounting
ISBN:
9781305088436
Author:
Carl Warren, Jim Reeve, Jonathan Duchac
Publisher:
Cengage Learning
Survey of Accounting (Accounting I)
Accounting
ISBN:
9781305961883
Author:
Carl Warren
Publisher:
Cengage Learning
Cornerstones of Financial Accounting
Accounting
ISBN:
9781337690881
Author:
Jay Rich, Jeff Jones
Publisher:
Cengage Learning

Financial Accounting: The Impact on Decision Make…
Accounting
ISBN:
9781305654174
Author:
Gary A. Porter, Curtis L. Norton
Publisher:
Cengage Learning