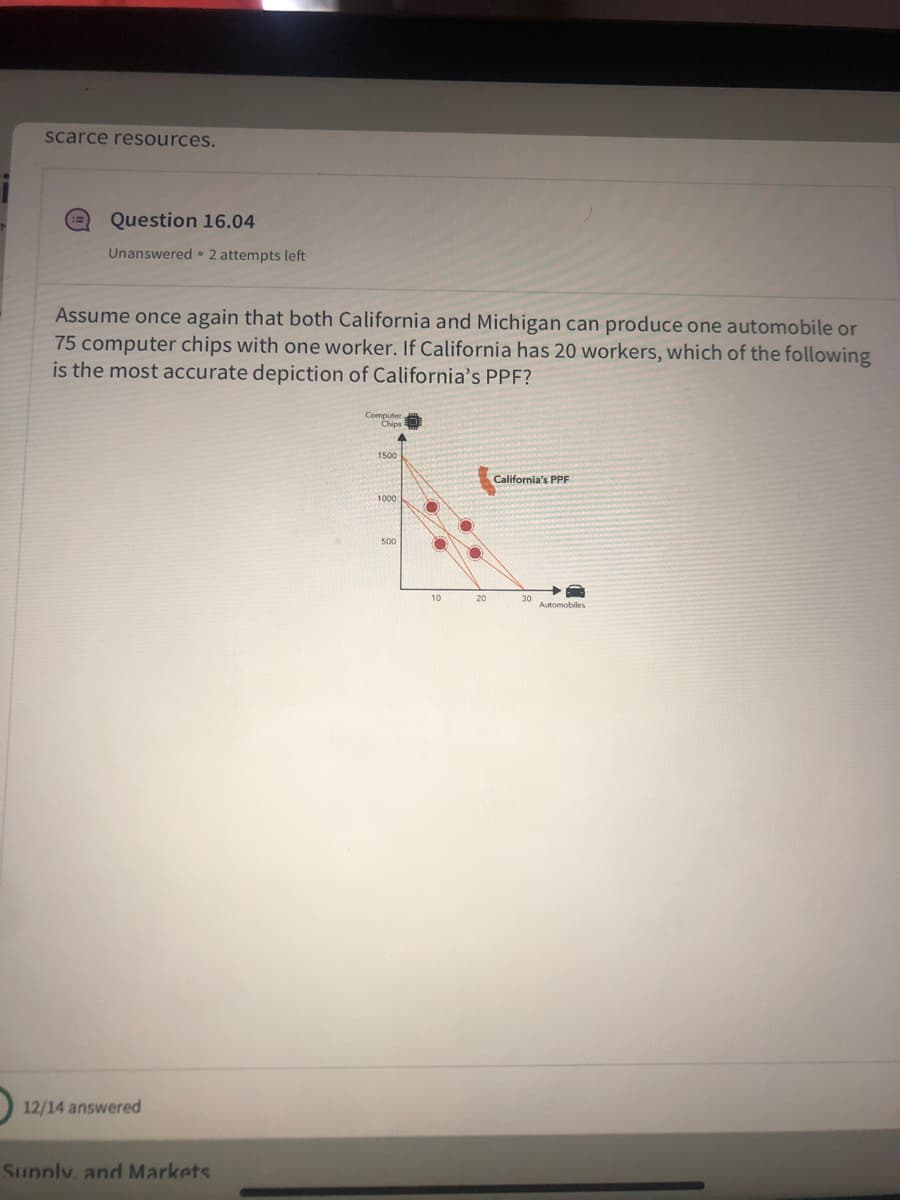
Assume once again that both California and Michigan can produce one automobile or 75 computer chips with one worker. If California has 20 workers, which of the following is the most accurate depiction of California's PPF? Computer Chips 1500 California's PPF 1000 500 10 20 30 Automobiles


Q: 12. Use the production possibility curve (PPC) to answer the question. If Zambia is currently on…
A: Production Possibility Curve Production possibility curve is a graph that shows all the possible…
Q: An American worker can produce either 5 cars or 8 tons of grain a year. A Japanese worker can…
A: United States: Production of 5 cars requires 1 workers in one year Implies, 5 cars = 1 worker 1 car…
Q: Consider the PPF of a country with movies on the horizontal axis and computers on the vertical axis.…
A: Production Possibility Frontier shows different possible combination of two goods that can be…
Q: Using a production possibilities frontier (PPF) diagram, determine how does the PPF change in…
A: Production possibility frontier (PPF) is the diagrammatic representation of all the combinations of…
Q: Explain how each of the following situations would affect the nations possibility curve. (iv) A…
A: Production possibility frontier (PPF) or national possibility curve is a locus of all the points…
Q: can you o=please solve this simple qouestoin
A: The problem of scarcity is a key economic problem that affects all countries without exception. This…
Q: e. Is it possible for USA to gain by trading with Thailand? Explain. f. Is it possible for Thailand…
A: Theory of comparative advantage states that a country should produce those goods where it has lower…
Q: Use the figure below to answer the questions that Tractors PPF, 14 PPF₁ 100 Rice (tons) İ. Suppose,…
A: The Production Possibility Frontier is a curve that denotes the mix of products that will use…
Q: A Production Possibilities Frontier shows Group of answer choices all the combinations of two goods…
A: Production Possibilities Frontier (PPF) is also known as the Production Possibilities Curve (PPC).
Q: 4. What is the opportunity cost of television production if we moved from combination E to D? 5.…
A: The production possibility frontier would result in the production of maximum output which can be…
Q: Using a production possibilities frontier (PPF) diagram, determine how does the PPF change in…
A: The curve that depicts various amounts of products that could be produced while making use of the…
Q: Illustrate the concept of economic growth on the PPC. Describe at least 2 factors that could cause…
A: Production possibility curve shows the trade off between 2 goods or services.
Q: Describe how each of the following would affect Bangladesh PPF: a) more job opportunities in Dhaka,…
A: In business/microeconomics, the PPF is a line/curve that represents the varieties in the sums that…
Q: mya and Donovan produce two goods in an 8 hour day. Mya can produce 10 capital or 55 consumables and…
A: The materials which a firm utilizes in the manufacturing to create commodities that can then be used…
Q: Refer to the accompanying figure. For the nation whose PPC is shown, it must be true that Milk…
A: Production possibility frontier shows the different combinations of two goods that can be produced…
Q: 7. Plot the PPC of a nation given by the following data. All Other Goods Combination Health Care A…
A: 7.c. The output combinations of two nations are given and they can be illustrated with the help of a…
Q: Suppose there are two countries Peru and Japan that produce Food and Fuel. Peru can produce 7,523…
A: "Since you have asked multiple parts, we will answer only first three parts for you. If you have any…
Q: Describe how each of the following would affect Bangladesh PPF using relevant graph: a) more job…
A: Production possibility frontier shows the different possible combination of inputs that gives the…
Q: Problem 4 News Flash: Wliam fails his last economics midterm. He realizes that he has spent too much…
A: Answer: Introduction: PPF (Production possibilities frontier): it refers to the curve that shows…
Q: sing a production possibilities frontier (PPF) diagram, determine how does the PPF change in…
A: Production Possibility Curve (PPC) is also known as the Production possibility frontier (PPF). PPF…
Q: When one producer has a comparative advantage in production, he or she a) can produce more output…
A: Opportunity cost refers to the loss of giving up best alternative while making a choice. There is…
Q: diagram, determine how does the PPF change in response to the following events: Make sure to…
A: DISCLAIMER “Since you have asked multiple question, we will solve the first three subpart question…
Q: Table 3-9 Summary of the Gains from Trade Without Trade Production and Consumption With Trade…
A: When the country only consumes what it produces, it is known as the close economy. When the country…
Q: Please assist; Suppose there are two countries Peru and Japan that produce Food and Fuel. Peru can…
A: Hello, thank you for the question. Since there are multiple subpart questions posted under the same…
Q: The PPF of the US goes from Apple's equals 200 oranges equals 0 to Apple's equal 0 oranges equals…
A: A production possibility frontier (PPF) shows the maximum possible output combinations of two goods…
Q: An American worker can produce either 5 cars or 8 tons of grain a year. A Japanese worker can…
A: Production possibility frontier shows different combinations of two goods that can be produced with…
Q: The following figure shows the production-possibility curves for Canada (AB) and the rest of the…
A: We are going to discuss the opportunity cost method to understand whether the trade is beneficial…
Q: Visualize a straight down-slope PPF (Production Possibility Frontier/Curve) for two countries the…
A: Opportunity cost is the forgone gain derived from the alternate option that is not chosen.
Q: In 2017, Nepal’s production of rice and machinery was published by the Nepal Bureau of Statistics…
A: Opportunity cost represents the potential benefits that an individual, investor, or business misses…
Q: Axis its Output for YO-YOs is 20 million (per year) and X-Axis its Output for Tennis Shoes is 10…
A: According to details written about both the countries United States and Taiwan, United States has…
Q: he table shows the amount of cherries or apples that Chile and Argentina can produce using one day…
A: Comparative advantage arises when the country produces good at lower opportunity cost than other…
Q: Table 19.3 Candles Soap Bryce 150 450 Tina 200 450 Bryce and Tina are artisans who produce homemade…
A: Opportunity cost is cost of choosing one alternative options at the cost of another alternative…
Q: Suppose we have the following information about the productivity of industry in Japan and Korea. The…
A: From the question, we know that Japanese workers can produce 6 units of steel or 3 TVs in an hour.…
Q: Give a definition of an advance in technology. Suppose that you are drawing a PPF for civilian goods…
A: Advance in technology can be understood when the same amount of resources is able to more than…
Q: The graph below represents the Production Possibility Frontier for the country of OZ for 2 groups of…
A: The production possibility frontier (PPF) shows the combination of the two goods or services that…
Q: Using the information provided in the table below, answer the following questions. Country A…
A: PPF, production possibilities frontier shows different combinations of two goods that can be…
Q: The following graphs show two possible PPFS for South Africa's economy: a straight-line PPF (PPF¡)…
A: Production possibility frontier: - it is the graphical representation of different combinations of…
Q: Show, using a curved PPF, what would happen if there was a terrible natural disaster that destroyed…
A: Destruction of natural resources would reduce the amount of the means of production. So the economy…
Q: In 2017, Nepal’s production of rice and machinery was published by the Nepal Bureau of Statistics…
A: A) The point B is inside the PPF. This shows the inefficient utilization of resources. The…
Q: Consider the production productivity matrix of two goods from the US and India: United States of…
A: Answer-
Q: In 2017, Nepal’s production of rice and machinery was published by the Nepal Bureau of Statistics…
A: The PPC can be illustrated as:
Q: Home has 1200 units of labor available. It can produce two goods, apples and bananas. The unit labor…
A: The economics as a study is used to focus on the idea that the societies have a limit to the amount…
Q: In 2017, Nepal’s production of rice and machinery was published by the Nepal Bureau of Statistics…
A: Hello. Since you have posted multiple parts of the question and not specified which part of the…
Q: Q3) Illustrate the Production Possibility Frontier by graph from the table below and explain what…
A: The production possibility frontier is the maximum that an economy can produce while using all its…
Q: 14. Which of the following is correct? a. The PPF must be concave. b. The PPF must be a straight…
A: NOTE: We'll answer the first question as the exact one is not specified. Please submit a new…


Trending now
This is a popular solution!

Step by step
Solved in 2 steps with 1 images

- Explain how each of the following situations would affect a nation's production possibility curve. (i) A technological innovation allows the nation to more efficiently convert solar energy into electricity. a) What happens to the PPF? b) Explain (ii) COVID-19 increases the number of unemployed workersin the nation. a) What happens to the PPF? b) Explain (iii) A global pandemic results in 6 million confirmed cases and the death of over 400,000 individuals. a) What happens to the PPF? b) EXplain (iv) A switch to online delivery, increases access to education in the nation's colledges and universities, but might have a detrimental impact on the quality of education. a) What happens to the PPF? b) Explain v) The nation passes a law requiring all employers to give the employees 16 weeks of paid vacation each year. Prior to this law employer were not legally required to give employees any paid vacation time. a) What happens to the PPF? b) ExplainConsider a simple economy of Korea - producing two goods, Motor bike and milk. The details ofthe economy and its production is as follows: Motor Bike (1000 / year) Milk (1000 gallons per year) 0 601 502 303 0 a) Make a graph of Korean economy’s production possibility frontier.b) Explain this logic, why this PPF curve is always downward sloping.c) Suppose this economy is producing 2000 motor bikes and 30,000 gallons of milk. What isthe opportunity cost of producing additional 20,000 gallons of milk?d) According to the (BGH) technology, farmers can now get double the amount of milk fromcows easily. In terms of PPF, this means Korean economy can now produce twice milk ateach level of bike output. With the current production of 2000 motor bikes, Mr. B claimsthat this new technology can allow this economy to produce more milk…Draw another diagram putting on it the original production possibility frontier you drew for (a), labelling it AA. (i) Draw a new production possibility frontier on the diagram, labelling it PP, which shows the position after a devastating war has hit the economy. (ii) Draw another PPF labelling it QQ which shows an increase in productivity in the econory such that output from the same amount of resources increases by 50 per cent in the public sector but twice that amount in the private sector. already finished part A need help with part B thanks!
- A nation with fixed quantities of resources is able to produce any of the following combinations of bread and ovens:Bread (tons) Oven (000’s)60 050 1240 2230 3020 3610 40 0 42These figures assume that a certain number of previously produced ovens are available in the current period for baking bread.a. Using data in the table, graph the ppf (with ovens on the vertical axis)b. What happens to the opportunity cost of bread – measured in number of ovens—as bread production increases from 0 to 10 tons, from 10 to 20 tons, from 20 to 30 tons, and so on?c. If this country chooses to produce both bread and ovens, what will happen to the ppf over time? Why? Select one:a. Remains stagnant b. Decline over time towards inefficiencyc. Increase over time and declined. Increase over time towards growthRepublika UPLB has 50 workers. It produces only coffee and white cheese. The production of these two goods has the following labor requirements. Coffee Output 60 56 48 36 20 0 Labor Requirements 50 40 30 20 10 0 White Cheese Output 0 2 4 6 8 10 Labor Requirements 0 10 20 30 40 50 Illustrate and explain the impact on the PPF if 10 workers decide to work overseas.In 2017, Nepal’s production of rice and machinery was published by the Nepal Bureau of Statistics (NBS) as indicated by the table below: Production in Nepal Position P Q R S T U V W X Y Z Rice (1000 tons) 0 10 26 37 45 50 55 59 66 77 80 Machinery (units) 90 89 85 80 75 70 65 60 50 30 0 Based on the table above, a production possibility frontier (PPF) for Nepal can be plotted as below: Use the NBS production table and production possibility frontier to answer the following questions: Name positions B, V and D. Also, as indicated in the table, supposing Nepal is operating at level T, what is the opportunity cost of producing 10,000 more tons of rice? Use the graph below to answer the questions that follow: B1: Suppose Nepal…
- In 2017, Nepal’s production of rice and machinery was published by the Nepal Bureau of Statistics (NBS) as indicated by the table below: Production in Nepal Position P Q R S T U V W X Y Z Rice (1000 tons) 0 10 26 37 45 50 55 59 66 77 80 Machinery (units) 90 89 85 80 75 70 65 60 50 30 0 Based on the table above, a production possibility frontier (PPF) for Nepal can be plotted as below: Use the NBS production table and production possibility frontier to answer the following questions: Name positions B, V and D. Also, as indicated in the table, supposing Nepal is operating at level T, what is the opportunity cost of producing 10,000 more tons of rice? Use the graph below to answer the questions that follow: (I have sent the picture…In 2017, Nepal’s production of rice and machinery was published by the Nepal Bureau of Statistics (NBS) as indicated by the table below: Production in Nepal Position P Q R S T U V W X Y Z Rice (1000 tons) 0 10 26 37 45 50 55 59 66 77 80 Machinery (units) 90 89 85 80 75 70 65 60 50 30 0 Based on the table above, a production possibility frontier (PPF) for Nepal can be plotted as below: Use the NBS production table and production possibility frontier to answer the following questions: Name positions B, V and D. Also, as indicated in the table, supposing Nepal is operating at level T, what is the opportunity cost of producing 10,000 more tons of rice? Use the graph below to answer the questions that follow:In 2017, Nepal’s production of rice and machinery was published by the Nepal Bureau of Statistics (NBS) as indicated by the table below: Production in Nepal Position P Q R S T U V W X Y Z Rice (1000 tons) 0 10 26 37 45 50 55 59 66 77 80 Machinery (units) 90 89 85 80 75 70 65 60 50 30 0 Based on the table above, a production possibility frontier (PPF) for Nepal can be plotted as below: Use the NBS production table and production possibility frontier to answer the following questions: Name positions B, V and D. Also, as indicated in the table, supposing Nepal is operating at level T, what is the opportunity cost of producing 10,000 more tons of rice?
- In 2017, Nepal’s production of rice and machinery was published by the Nepal Bureau of Statistics (NBS) as indicated by the table below: Production in Nepal Position P Q R S T U V W X Y Z Rice (1000 tons) 0 10 26 37 45 50 55 59 66 77 80 Machinery (units) 90 89 85 80 75 70 65 60 50 30 0 Based on the table above, a production possibility frontier (PPF) for Nepal can be plotted as below: Use the NBS production table and production possibility frontier to answer the following questions: (A) Name positions B, V and D. Also, as indicated in the table, supposing Nepal is operating at level T, what is the opportunity cost of producing 10,000 more tons of rice? (B) Use the graph below to answer the questions that follow: B1: Suppose Nepal begins to manufacture fertilizers. Explain the impact of the discovery of fertilizers on Nepal’s economy…Explain how each of the following situations would affect a nation’s production possibilities curve (i) A technological innovation allows the nation to more efficiently covert solar energy to electricity What happens to PPF ExplanationQ4. Explain the concept of efficiency in production using PPF.


