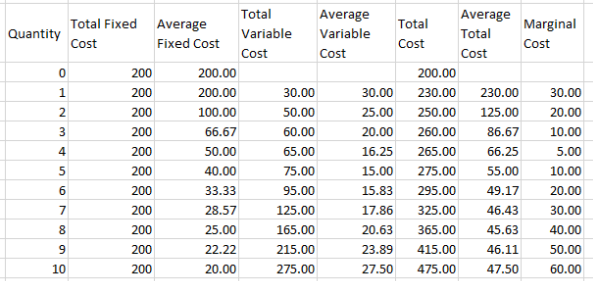
Assume that the above cost data is for a perfectly competitive firm. Using this data answer the following: (See Atteched) (a) If the market equilibrium price that this firm charges is $50, what level of output must this firm produce to maximize its profit? (b) What would be the amount of profit that this firm would earn if it produced at the profit-maximizing level of output?


2. Assume that the above cost data is for a
(a) If the
(b) What would be the amount of profit that this firm would earn if it produced at the profit-maximizing level of output?
3. You read in a business magazine that farmers are reaping high profits. With the theory of perfect competition in mind, what do you
expect to happen over time (in the long run) to each of the following?
a. The prices of agricultural products
b. The profits of farmers
c. The equilibrium output in agricultural markets
d. The number of farms
4. Distinguish between economies of scale and diseconomies of scale. Give examples of why a firm may experience economies of scale.


Trending now
This is a popular solution!

Step by step
Solved in 3 steps with 1 images


