Assuming the demand changed from D1 to D2, and we examine the adjustment process from an horizontal perspective, which of the following statements about the sequence of changes in the this adjustment process is TRUE? (A step in the sequence could have more than one event.)     The initial equilibrium is at P=$15, and Q=116     First, the price of the good increases.     Third, as the price is increasing, quantity supplied increases.     Second the quantity demanded increases to 16, creating a market shortage.     The initial equilibrium is at P=$15 and Q=12     Fourth, a new equilibrium is established at P=18 and Q=16.     First, the quantity demanded increases from 12 to 20, creating a market surplus.     First, the quantity demanded increases from 12 to 20, creating a market shortage.     Second, as they face a shortage of the good buyers will bid up its price.     Third, as the price is increasing, quantity demanded will decrease.

ENGR.ECONOMIC ANALYSIS
14th Edition
ISBN:9780190931919
Author:NEWNAN
Publisher:NEWNAN
Chapter1: Making Economics Decisions
Section: Chapter Questions
Problem 1QTC
icon
Related questions
Question

Assuming the demand changed from D1 to D2, and we examine the adjustment process from an horizontal perspective, which of the following statements about the sequence of changes in the this adjustment process is TRUE? (A step in the sequence could have more than one event.)


The initial equilibrium is at P=$15, and Q=116


First, the price of the good increases.


Third, as the price is increasing, quantity supplied increases.


Second the quantity demanded increases to 16, creating a market shortage.


The initial equilibrium is at P=$15 and Q=12


Fourth, a new equilibrium is established at P=18 and Q=16.


First, the quantity demanded increases from 12 to 20, creating a market surplus.


First, the quantity demanded increases from 12 to 20, creating a market shortage.


Second, as they face a shortage of the good buyers will bid up its price.


Third, as the price is increasing, quantity demanded will decrease.

28 P
S
24
20
16
12
D2
8
D1
Q
24
4 8
12
16
20
Transcribed Image Text:28 P S 24 20 16 12 D2 8 D1 Q 24 4 8 12 16 20
Expert Solution
Step 1

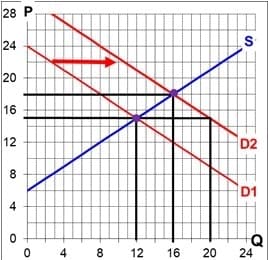
The demand curve in the above graph is downward sloping indicating the negative relationship between the quantity demanded and price of the good. 

trending now

Trending now

This is a popular solution!

steps

Step by step

Solved in 2 steps

Blurred answer
Knowledge Booster
Equilibrium Point
Learn more about
Need a deep-dive on the concept behind this application? Look no further. Learn more about this topic, economics and related others by exploring similar questions and additional content below.
Recommended textbooks for you
ENGR.ECONOMIC ANALYSIS
Economics
ISBN:
9780190931919
Author:
NEWNAN
Publisher:
Oxford University Press
Principles of Economics (12th Edition)
Economics
ISBN:
9780134078779
Author:
Karl E. Case, Ray C. Fair, Sharon E. Oster
Publisher:
PEARSON
Engineering Economy (17th Edition)
Economics
ISBN:
9780134870069
Author:
William G. Sullivan, Elin M. Wicks, C. Patrick Koelling
Publisher:
PEARSON
Principles of Economics (MindTap Course List)
Economics
ISBN:
9781305585126
Author:
N. Gregory Mankiw
Publisher:
Cengage Learning
Managerial Economics: A Problem Solving Approach
Economics
ISBN:
9781337106665
Author:
Luke M. Froeb, Brian T. McCann, Michael R. Ward, Mike Shor
Publisher:
Cengage Learning
Managerial Economics & Business Strategy (Mcgraw-…
Economics
ISBN:
9781259290619
Author:
Michael Baye, Jeff Prince
Publisher:
McGraw-Hill Education