At a large midwestern university, a simple random sample of 100 entering freshmen in 1993 found that 20 of the sampled freshmen finished in the bottom third of their high school class. Admission standards at the university were tightened in 1995. In 1997, a simple random sample of 100 entering freshmen found that only 10 finished in the bottom third of their high school class. Let p, and p, be the proportions of all entering freshmen in 1993 and 1997, respectively, who graduated in the bottom third of their high school class. 6. What is a 90% plus four confidence interval for p, – p;? Os0'0 + 860'0v B)0.098 + 0.083 C)0.098 +0.099 D0.098 +0.130
At a large midwestern university, a simple random sample of 100 entering freshmen in 1993 found that 20 of the sampled freshmen finished in the bottom third of their high school class. Admission standards at the university were tightened in 1995. In 1997, a simple random sample of 100 entering freshmen found that only 10 finished in the bottom third of their high school class. Let p, and p, be the proportions of all entering freshmen in 1993 and 1997, respectively, who graduated in the bottom third of their high school class. 6. What is a 90% plus four confidence interval for p, – p;? Os0'0 + 860'0v B)0.098 + 0.083 C)0.098 +0.099 D0.098 +0.130

Algebra & Trigonometry with Analytic Geometry
13th Edition
ISBN:9781133382119
Author:Swokowski
Publisher:Swokowski
Chapter10: Sequences, Series, And Probability
Section10.8: Probability
Problem 38E

Related questions

Topic Video
Question
Hi I know that you can’t answer every question is there anyway you can just answer question 6 please?
Transcribed Image Text:3:03
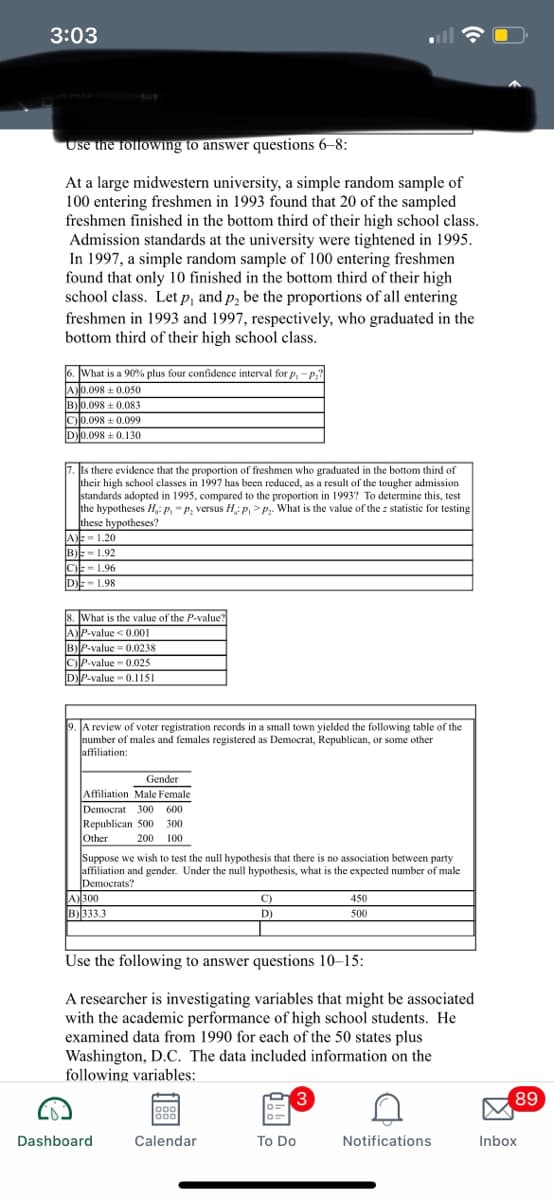
Use the following to answer questions 6-8:
At a large midwestern university, a simple random sample of
100 entering freshmen in 1993 found that 20 of the sampled
freshmen finished in the bottom third of their high school class.
Admission standards at the university were tightened in 1995.
In 1997, a simple random sample of 100 entering freshmen
found that only 10 finished in the bottom third of their high
school class. Let p, and p, be the proportions of all entering
freshmen in 1993 and 1997, respectively, who graduated in the
bottom third of their high school class.
What is a 90% plus four confidence interval for p, -P;?
A0.098 + 0.050
B)0.098 + 0.083
C)0.098 + 0.099
D0.098 +0.130
Is there evidence that the proportion of freshmen who graduated in the bottom third of
their high school classes in 1997 has been reduced, as a result of the tougher admission
standards adopted in 1995, compared to the proportion in 1993? To determine this, test
the hypotheses H: p. -p, versus H: p, >P. What is the value of the z statistic for testing
these hypotheses?
A) = 1.20
B)E- 1.92
C)- 1.96
DE-1.98
8. What is the value of the P-value?
AP-value <0.001
B)P-value 0.0238
C)P-value - 0.025
DP-value - 0,1151
A review of voter registration records in a small town yielded the following table of the
number of males and females registered as Democrat, Republican, or some other
affiliation:
Gender
Affiliation Male Female
Democrat 300 600
Republican 500 300
Other
200 100
Suppose we wish to test the null hypothesis that there is no association between party
affiliation and gender. Under the null hypothesis, what is the expected number of male
Democrats?
A)300
B)333.3
C)
450
D)
500
Use the following to answer questions 10–15:
A researcher is investigating variables that might be associated
with the academic performance of high school students. He
examined data from 1990 for each of the 50 states plus
Washington, D.C. The data included information on the
following variables:
3
89
ooo
o00
Dashboard
Calendar
To Do
Notifications
Inbox
Expert Solution
This question has been solved!
Explore an expertly crafted, step-by-step solution for a thorough understanding of key concepts.

This is a popular solution!

Trending now
This is a popular solution!

Step by step
Solved in 2 steps

Knowledge Booster


Learn more about
Need a deep-dive on the concept behind this application? Look no further. Learn more about this topic, statistics and related others by exploring similar questions and additional content below.Recommended textbooks for you
Algebra & Trigonometry with Analytic Geometry
Algebra
ISBN:
9781133382119
Author:
Swokowski
Publisher:
Cengage

Holt Mcdougal Larson Pre-algebra: Student Edition…
Algebra
ISBN:
9780547587776
Author:
HOLT MCDOUGAL
Publisher:
HOLT MCDOUGAL
Algebra & Trigonometry with Analytic Geometry
Algebra
ISBN:
9781133382119
Author:
Swokowski
Publisher:
Cengage
Holt Mcdougal Larson Pre-algebra: Student Edition…
Algebra
ISBN:
9780547587776
Author:
HOLT MCDOUGAL
Publisher:
HOLT MCDOUGAL