At a price of $3, Nam demands how many units? Quantity Demanded Fon Nam Market Demand Price 10 9 Ying Som Gob Yam 1 1 8 7 2 2 4 1 4 4 9 1 3 4 21 26 5 1 1 8 3 7 8 29 1 7 10 10 5 36 40 2 1 10 9 1 1 7 12 11 10 7 48 23 의
At a price of $3, Nam demands how many units? Quantity Demanded Fon Nam Market Demand Price 10 9 Ying Som Gob Yam 1 1 8 7 2 2 4 1 4 4 9 1 3 4 21 26 5 1 1 8 3 7 8 29 1 7 10 10 5 36 40 2 1 10 9 1 1 7 12 11 10 7 48 23 의

Chapter4: Demand, Supply, And Market Equilibrium
Section: Chapter Questions
Problem 25P

Related questions
Question
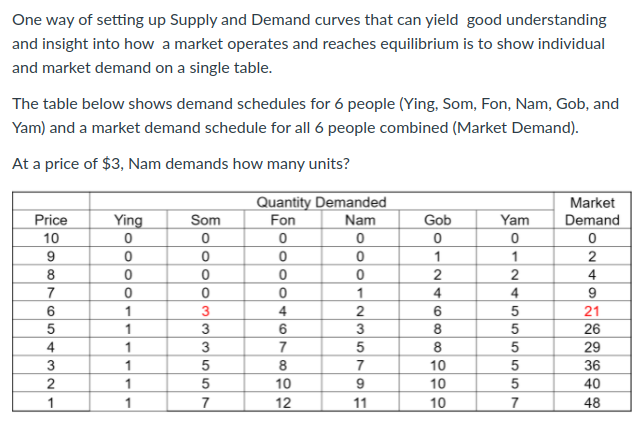
Transcribed Image Text:One way of setting up Supply and Demand curves that can yield good understanding
and insight into how a market operates and reaches equilibrium is to show individual
and market demand on a single table.
The table below shows demand schedules for 6 people (Ying, Som, Fon, Nam, Gob, and
Yam) and a market demand schedule for all 6 people combined (Market Demand).
At a price of $3, Nam demands how many units?
Quantity Demanded
Fon
Nam
Market
Demand
Price
Ying
Som
Gob
Yam
10
1
1
2
4
2
7
1
4
4
9
1
21
1
3
3
8.
5
26
4
1
3
7
29
3
1
7
10
5
36
2
10
12
1
9
10
40
1
1
7
11
10
7
48
OO o O
Expert Solution
This question has been solved!
Explore an expertly crafted, step-by-step solution for a thorough understanding of key concepts.

This is a popular solution!

Trending now
This is a popular solution!

Step by step
Solved in 2 steps with 2 images

Knowledge Booster


Learn more about
Need a deep-dive on the concept behind this application? Look no further. Learn more about this topic, economics and related others by exploring similar questions and additional content below.Recommended textbooks for you
Exploring Economics
Economics
ISBN:
9781544336329
Author:
Robert L. Sexton
Publisher:
SAGE Publications, Inc


Principles of Economics 2e
Economics
ISBN:
9781947172364
Author:
Steven A. Greenlaw; David Shapiro
Publisher:
OpenStax
Exploring Economics
Economics
ISBN:
9781544336329
Author:
Robert L. Sexton
Publisher:
SAGE Publications, Inc
Principles of Economics 2e
Economics
ISBN:
9781947172364
Author:
Steven A. Greenlaw; David Shapiro
Publisher:
OpenStax


Macroeconomics: Principles and Policy (MindTap Co…
Economics
ISBN:
9781305280601
Author:
William J. Baumol, Alan S. Blinder
Publisher:
Cengage Learning

Microeconomics: Principles & Policy
Economics
ISBN:
9781337794992
Author:
William J. Baumol, Alan S. Blinder, John L. Solow
Publisher:
Cengage Learning