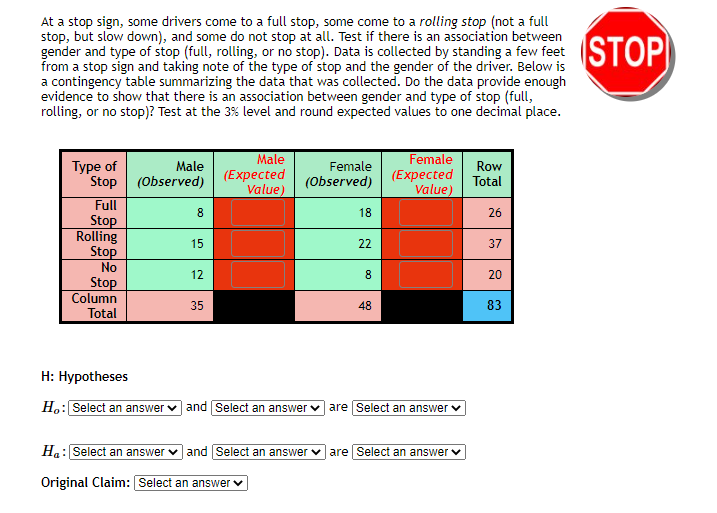
At a stop sign, some drivers come to a full stop, some come to a rolling stop (not a full stop, but slow down), and some do not stop at all. Test if there is an association between gender and type of stop (full, rolling, or no stop). Data is collected by standing a few feet from a stop sign and taking note of the type of stop and the gender of the driver. Below is a contingency table summarizing the data that was collected. Do the data provide enough evidence to show that there is an association between gender and type of stop (full, rolling, or no stop)? Test at the 3% level and round expected values to one decimal place. Туре of Stop (Observed) Male (Expected Value) Female (Еxpected Value) Male Female Row Total (Observed) Full Stop Rolling Stop No Stop Column 18 26 22 37 12 8. 20 35 48 83 Total 15
At a stop sign, some drivers come to a full stop, some come to a rolling stop (not a full stop, but slow down), and some do not stop at all. Test if there is an association between gender and type of stop (full, rolling, or no stop). Data is collected by standing a few feet from a stop sign and taking note of the type of stop and the gender of the driver. Below is a contingency table summarizing the data that was collected. Do the data provide enough evidence to show that there is an association between gender and type of stop (full, rolling, or no stop)? Test at the 3% level and round expected values to one decimal place. Туре of Stop (Observed) Male (Expected Value) Female (Еxpected Value) Male Female Row Total (Observed) Full Stop Rolling Stop No Stop Column 18 26 22 37 12 8. 20 35 48 83 Total 15

Glencoe Algebra 1, Student Edition, 9780079039897, 0079039898, 2018
18th Edition
ISBN:9780079039897
Author:Carter
Publisher:Carter
Chapter10: Statistics
Section: Chapter Questions
Problem 13PT

Related questions

Topic Video
Question
Transcribed Image Text:At a stop sign, some drivers come to a full stop, some come to a rolling stop (not a full
stop, but slow down), and some do not stop at all. Test if there is an association between
gender and type of stop (full, rolling, or no stop). Data is collected by standing a few feet ISTOPI
from a stop sign and taking note of the type of stop and the gender of the driver. Below is
a contingency table summarizing the data that was collected. Do the data provide enough
evidence to show that there is an association between gender and type of stop (full,
rolling, or no stop)? Test at the 3% level and round expected values to one decimal place.
Туре of
Stop (Observed)
Male
(Expected
Value)
Female
(Expected
Value)
Male
Female
Row
(Observed)
Total
Full
Stop
Rolling
Stop
No
8
18
26
15
22
37
12
8
20
Stop
Column
35
48
83
Total
H: Hypotheses
H.: Select an answer
and Select an answer v are Select an answer v
Ha: Select an answer v and Select an answer v are Select an answer v
Original Claim: Select an answer v
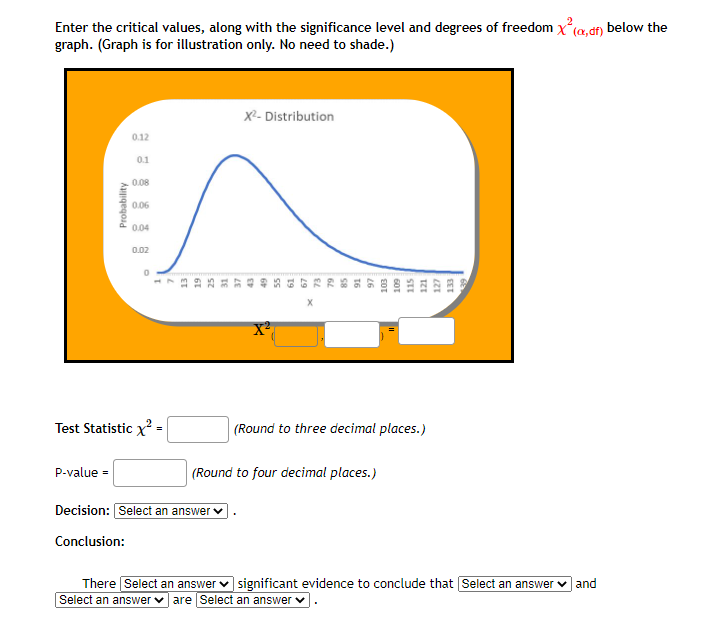
Transcribed Image Text:Enter the critical values, along with the significance level and degrees of freedom x(a,df) below the
graph. (Graph is for illustration only. No need to shade.)
X- Distribution
0.12
0.1
0.08
0.06
0.04
0.02
Test Statistic x?
(Round to three decimal places.)
P-value =
(Round to four decimal places.)
Decision: Select an answer v
Conclusion:
There Select an answer v significant evidence to conclude that Select an answer v and
Select an answer v are Select an answer V.
STE
60T
103
16
S8
61
LE
25
ET
Probability
Expert Solution
This question has been solved!
Explore an expertly crafted, step-by-step solution for a thorough understanding of key concepts.

This is a popular solution!

Trending now
This is a popular solution!

Step by step
Solved in 3 steps with 1 images

Knowledge Booster


Learn more about
Need a deep-dive on the concept behind this application? Look no further. Learn more about this topic, statistics and related others by exploring similar questions and additional content below.Recommended textbooks for you
Glencoe Algebra 1, Student Edition, 9780079039897…
Algebra
ISBN:
9780079039897
Author:
Carter
Publisher:
McGraw Hill

Big Ideas Math A Bridge To Success Algebra 1: Stu…
Algebra
ISBN:
9781680331141
Author:
HOUGHTON MIFFLIN HARCOURT
Publisher:
Houghton Mifflin Harcourt
Glencoe Algebra 1, Student Edition, 9780079039897…
Algebra
ISBN:
9780079039897
Author:
Carter
Publisher:
McGraw Hill
Big Ideas Math A Bridge To Success Algebra 1: Stu…
Algebra
ISBN:
9781680331141
Author:
HOUGHTON MIFFLIN HARCOURT
Publisher:
Houghton Mifflin Harcourt