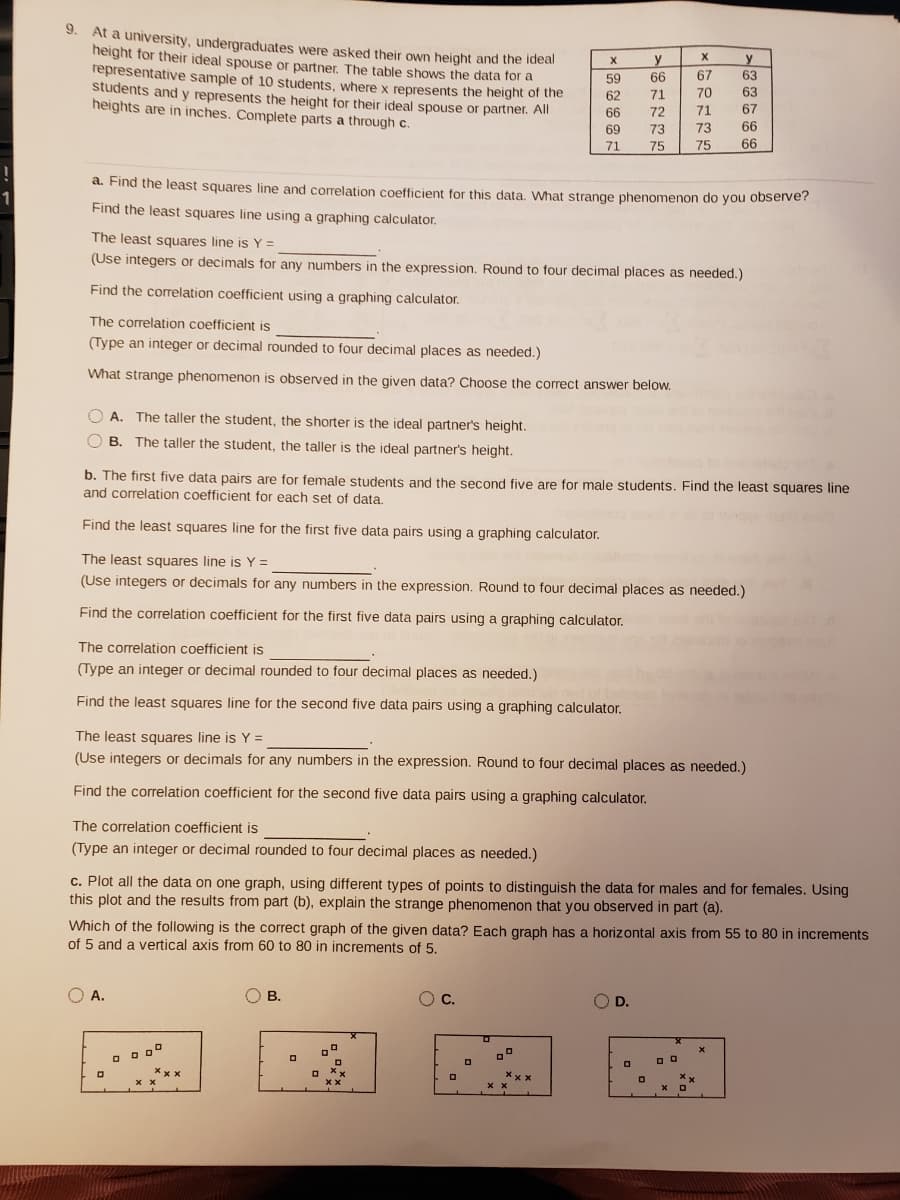
At a university, undergraduates were asked their own height and the ideal height for their ideal spouse or partner. The table shows the data for a representative sample of 10 students, where x represents the height of the students and y represents the height for their ideal spouse or partner. All heights are in inches. Complete parts a through c. a. Find the least squares line and correlation coefficient for this data. What stran Find the least squares line using a graphing calculator.
At a university, undergraduates were asked their own height and the ideal height for their ideal spouse or partner. The table shows the data for a representative sample of 10 students, where x represents the height of the students and y represents the height for their ideal spouse or partner. All heights are in inches. Complete parts a through c. a. Find the least squares line and correlation coefficient for this data. What stran Find the least squares line using a graphing calculator.

Glencoe Algebra 1, Student Edition, 9780079039897, 0079039898, 2018
18th Edition
ISBN:9780079039897
Author:Carter
Publisher:Carter
Chapter10: Statistics
Section10.5: Comparing Sets Of Data
Problem 26PFA

Related questions
Question
Transcribed Image Text:9.
At a university, undergraduates were asked their own height and the idean
height for their ideal spouse or partner. The table shows the data for a
representative sample of 10 students, where x represents the height of the
students and y represents the height for their ideal spouse or partner. All
heights are in inches. Complete parts a through c.
y
y
59
66
67
63
62
71
70
63
66
72
71
67
69
73
73
66
71
75
75
66
a. Find the least squares line and correlation coefficient for this data. What strange phenomenon do you observe?
Find the least squares line using a graphing calculator.
The least squares line is Y =
(Use integers or decimals for any numbers in the expression. Round to four decimal places as needed.)
Find the correlation coefficient using a graphing calculator.
The correlation coefficient is
(Type an integer or decimal rounded to four decimal places as needed.)
What strange phenomenon is observed in the given data? Choose the correct answer below.
O A. The taller the student, the shorter is the ideal partner's height.
O B. The taller the student, the taller is the ideal partner's height.
b. The first five data pairs are for female students and the second five are for male students. Find the least squares line
and correlation coefficient for each set of data.
Find the least squares line for the first five data pairs using a graphing calculator.
The least squares line is Y =
(Use integers or decimals for any numbers in the expression. Round to four decimal places as needed.)
Find the correlation coefficient for the first five data pairs using a graphing calculator.
The correlation coefficient is
(Type an integer or decimal rounded to four decimal places as needed.)
Find the least squares line for the second five data pairs using a graphing calculator.
The least squares line is Y =
(Use integers or decimals for any numbers in the expression. Round to four decimal places as needed.)
Find the correlation coefficient for the second five data pairs using a graphing calculator.
The correlation coefficient is
(Type an integer or decimal rounded to four decimal places as needed.)
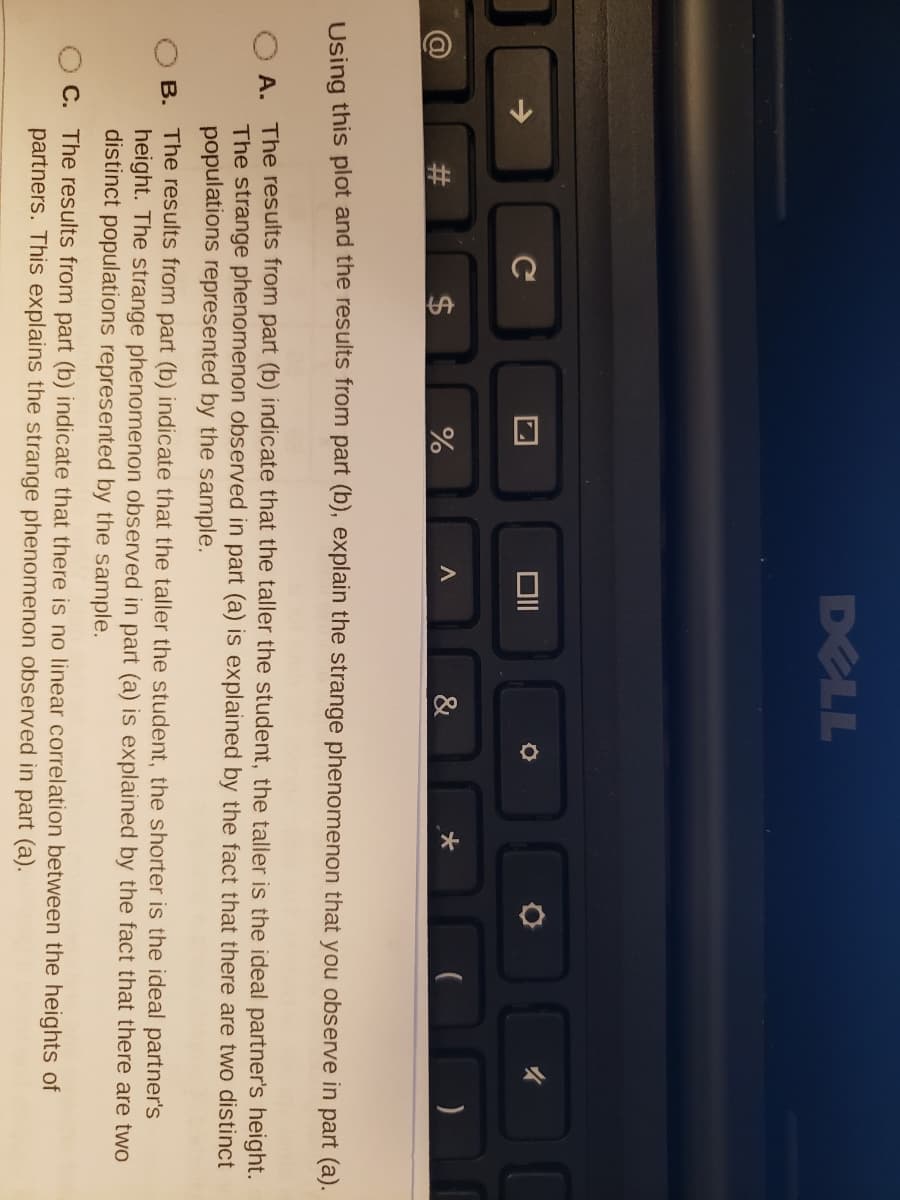
c. Plot all the data on one graph, using different types of points to distinguish the data for males and for females. Using
this plot and the results from part (b), explain the strange phenomenon that you observed in part (a).
Which of the following is the correct graph of the given data? Each graph has a horizontal axis from 55 to 80 in increments
of 5 and a vertical axis from 60 to 80 in increments of 5.
O A.
O B.
В.
Oc.
O D.
Xxx
Transcribed Image Text:%23
%24
DELL
->
&
Using this plot and the results from part (b), explain the strange phenomenon that you observe in part (a).
A. The results from part (b) indicate that the taller the student, the taller is the ideal partner's height.
The strange phenomenon observed in part (a) is explained by the fact that there are two distinct
populations represented by the sample.
B. The results from part (b) indicate that the taller the student, the shorter is the ideal partner's
height. The strange phenomenon observed in part (a) is explained by the fact that there are two
distinct populations represented by the sample.
C. The results from part (b) indicate that there is no linear correlation between the heights of
partners. This explains the strange phenomenon observed in part (a).
Expert Solution
This question has been solved!
Explore an expertly crafted, step-by-step solution for a thorough understanding of key concepts.

This is a popular solution!

Trending now
This is a popular solution!

Step by step
Solved in 2 steps with 1 images

Recommended textbooks for you
Glencoe Algebra 1, Student Edition, 9780079039897…
Algebra
ISBN:
9780079039897
Author:
Carter
Publisher:
McGraw Hill

Big Ideas Math A Bridge To Success Algebra 1: Stu…
Algebra
ISBN:
9781680331141
Author:
HOUGHTON MIFFLIN HARCOURT
Publisher:
Houghton Mifflin Harcourt
Glencoe Algebra 1, Student Edition, 9780079039897…
Algebra
ISBN:
9780079039897
Author:
Carter
Publisher:
McGraw Hill
Big Ideas Math A Bridge To Success Algebra 1: Stu…
Algebra
ISBN:
9781680331141
Author:
HOUGHTON MIFFLIN HARCOURT
Publisher:
Houghton Mifflin Harcourt