Like father, like son: In 1906, the statistician Karl Pearson measured the heights of 1078 pairs of fathers and sons. The following table presents a sample of 6 pairs, with height measured in inches, simulated from the distribution specified by Pearson. Father's Son's height height 69.3 71.4 66.7 68.8 70.7 71.0 65.7 70.9 72.4 69.1 65.4 66.0 Send data to Excel The least-squares regression line y = b, + b,x = 50.5230 +0.2781x and E (x-x)´ = 41.2733 are known for this data. Use the critical value method to test H, : B1 = 0 versus H : B, # 0. Can you conclude that the father's height is useful in predicting the son's height? Use the a = 0.05 level of significance. Part: 0/ 4 Part 1 of 4 Find the critical value(s). Round the answer to three decimal places. If there is more than one critical value, separate them with commas. Critical value(s):
Like father, like son: In 1906, the statistician Karl Pearson measured the heights of 1078 pairs of fathers and sons. The following table presents a sample of 6 pairs, with height measured in inches, simulated from the distribution specified by Pearson. Father's Son's height height 69.3 71.4 66.7 68.8 70.7 71.0 65.7 70.9 72.4 69.1 65.4 66.0 Send data to Excel The least-squares regression line y = b, + b,x = 50.5230 +0.2781x and E (x-x)´ = 41.2733 are known for this data. Use the critical value method to test H, : B1 = 0 versus H : B, # 0. Can you conclude that the father's height is useful in predicting the son's height? Use the a = 0.05 level of significance. Part: 0/ 4 Part 1 of 4 Find the critical value(s). Round the answer to three decimal places. If there is more than one critical value, separate them with commas. Critical value(s):

Glencoe Algebra 1, Student Edition, 9780079039897, 0079039898, 2018
18th Edition
ISBN:9780079039897
Author:Carter
Publisher:Carter
Chapter10: Statistics
Section10.4: Distributions Of Data
Problem 19PFA

Related questions
Question
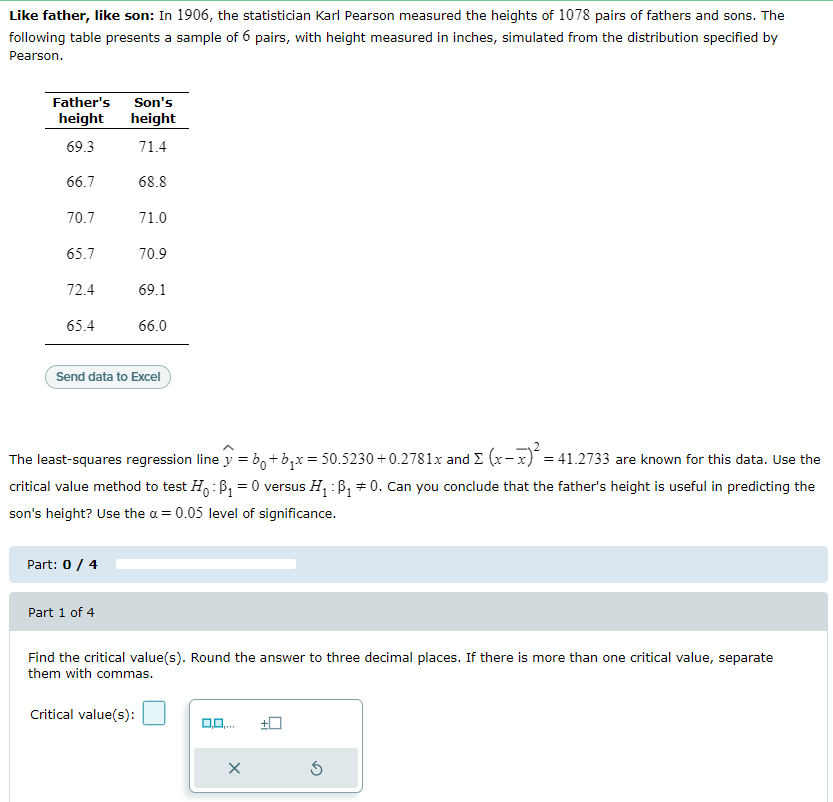
Transcribed Image Text:Like father, like son: In 1906, the statistician Karl Pearson measured the heights of 1078 pairs of fathers and sons. The
following table presents a sample of 6 pairs, with height measured in inches, simulated from the distribution specified by
Pearson.
Son's
height
Father's
height
69.3
71.4
66.7
68.8
70.7
71.0
65.7
70.9
72.4
69.1
65.4
66.0
Send data to Excel
The least-squares regression line y = b, +b,x= 50.5230 + 0.2781x and E (x-x)* = 41.2733 are known for this data. Use the
critical value method to test H,:B, = 0 versus H, : B, # 0. Can you conclude that the father's height is useful in predicting the
son's height? Use the a = 0.05 level of significance.
Part: 0/ 4
Part 1 of 4
Find the critical value(s). Round the answer to three decimal places. If there is more than one critical value, separate
them with commas.
Critical value(s):
Expert Solution
This question has been solved!
Explore an expertly crafted, step-by-step solution for a thorough understanding of key concepts.

This is a popular solution!

Trending now
This is a popular solution!

Step by step
Solved in 2 steps

Recommended textbooks for you
Glencoe Algebra 1, Student Edition, 9780079039897…
Algebra
ISBN:
9780079039897
Author:
Carter
Publisher:
McGraw Hill

College Algebra (MindTap Course List)
Algebra
ISBN:
9781305652231
Author:
R. David Gustafson, Jeff Hughes
Publisher:
Cengage Learning
Glencoe Algebra 1, Student Edition, 9780079039897…
Algebra
ISBN:
9780079039897
Author:
Carter
Publisher:
McGraw Hill
College Algebra (MindTap Course List)
Algebra
ISBN:
9781305652231
Author:
R. David Gustafson, Jeff Hughes
Publisher:
Cengage Learning