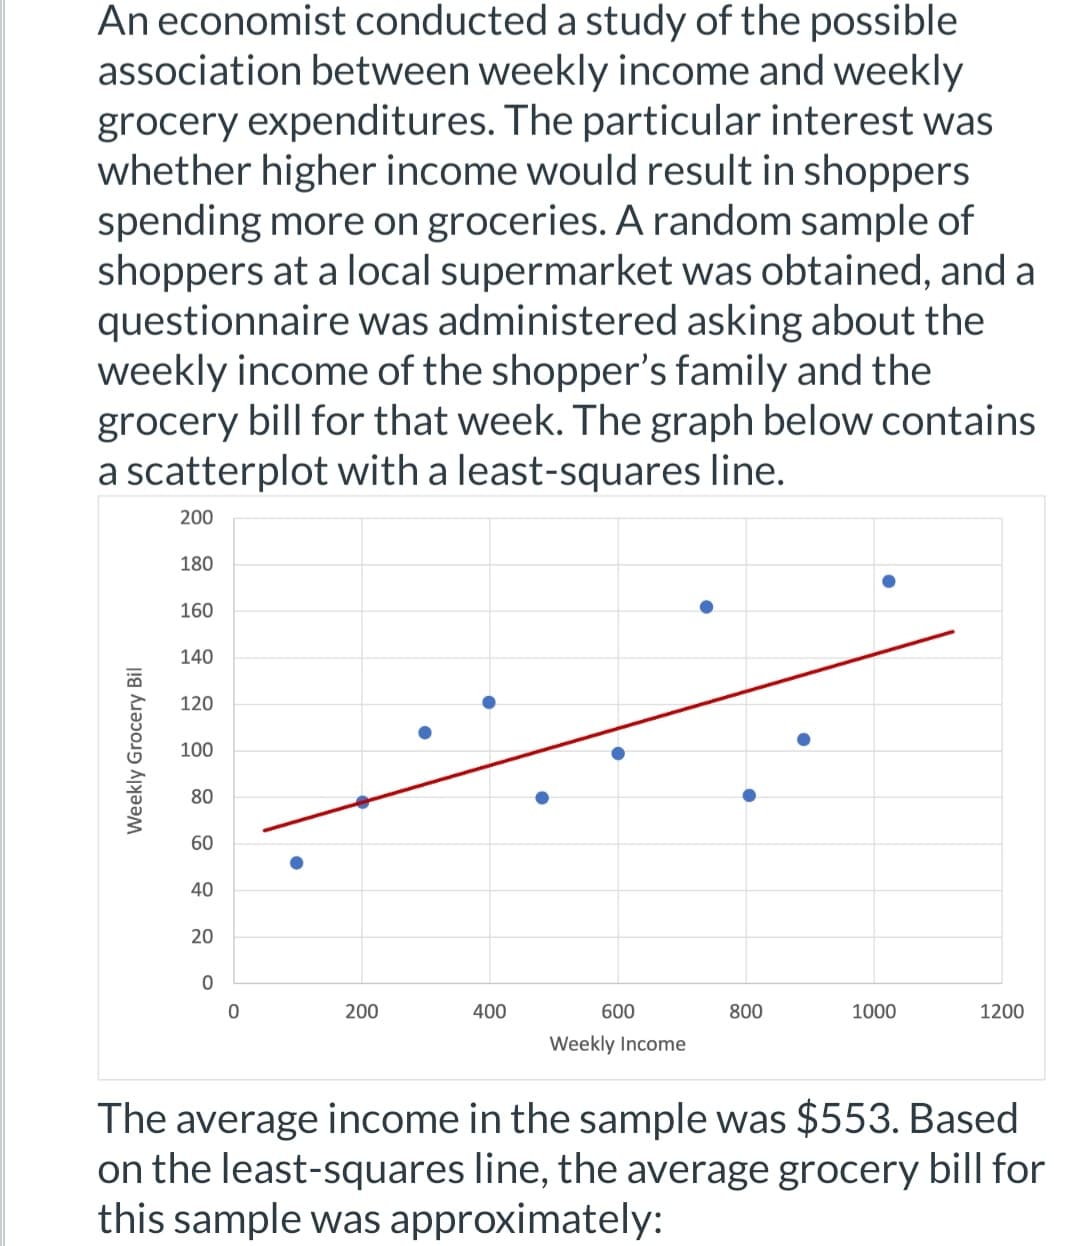
An economist conducted a study of the possible association between weekly income and weekly grocery expenditures. The particular interest was whether higher income would result in shoppers spending more on groceries. A random sample of shoppers at a local supermarket was obtained, and a questionnaire was administered asking about the weekly income of the shopper's family and the grocery bill for that week. The graph below contains a scatterplot with a least-squares line. 200 180 160 140 120 100 80 60 40 20 0 200 400 600 800 1000 1200 Weekly Income The average income in the sample was $553. Based on the least-squares line, the average grocery bill for this sample was approximately: Weekly Grocery Bil 0
An economist conducted a study of the possible association between weekly income and weekly grocery expenditures. The particular interest was whether higher income would result in shoppers spending more on groceries. A random sample of shoppers at a local supermarket was obtained, and a questionnaire was administered asking about the weekly income of the shopper's family and the grocery bill for that week. The graph below contains a scatterplot with a least-squares line. 200 180 160 140 120 100 80 60 40 20 0 200 400 600 800 1000 1200 Weekly Income The average income in the sample was $553. Based on the least-squares line, the average grocery bill for this sample was approximately: Weekly Grocery Bil 0

MATLAB: An Introduction with Applications
6th Edition
ISBN:9781119256830
Author:Amos Gilat
Publisher:Amos Gilat
Chapter1: Starting With Matlab
Section: Chapter Questions
Problem 1P

Related questions
Question
Transcribed Image Text:An economist conducted a study of the possible
association between weekly income and weekly
grocery expenditures. The particular interest was
whether higher income would result in shoppers
spending more on groceries. A random sample of
shoppers at a local supermarket was obtained, and a
questionnaire was administered asking about the
weekly income of the shopper's family and the
grocery bill for that week. The graph below contains
a scatterplot with a least-squares line.
200
180
160
140
120
100
80
60
40
20
0
0
200
400
600
800
1000
1200
Weekly Income
The average income in the sample was $553. Based
on the least-squares line, the average grocery bill for
this sample was approximately:
Weekly Grocery Bil
Expert Solution
This question has been solved!
Explore an expertly crafted, step-by-step solution for a thorough understanding of key concepts.

This is a popular solution!

Trending now
This is a popular solution!

Step by step
Solved in 2 steps

Recommended textbooks for you
MATLAB: An Introduction with Applications
Statistics
ISBN:
9781119256830
Author:
Amos Gilat
Publisher:
John Wiley & Sons Inc

Probability and Statistics for Engineering and th…
Statistics
ISBN:
9781305251809
Author:
Jay L. Devore
Publisher:
Cengage Learning

Statistics for The Behavioral Sciences (MindTap C…
Statistics
ISBN:
9781305504912
Author:
Frederick J Gravetter, Larry B. Wallnau
Publisher:
Cengage Learning
MATLAB: An Introduction with Applications
Statistics
ISBN:
9781119256830
Author:
Amos Gilat
Publisher:
John Wiley & Sons Inc
Probability and Statistics for Engineering and th…
Statistics
ISBN:
9781305251809
Author:
Jay L. Devore
Publisher:
Cengage Learning
Statistics for The Behavioral Sciences (MindTap C…
Statistics
ISBN:
9781305504912
Author:
Frederick J Gravetter, Larry B. Wallnau
Publisher:
Cengage Learning

Elementary Statistics: Picturing the World (7th E…
Statistics
ISBN:
9780134683416
Author:
Ron Larson, Betsy Farber
Publisher:
PEARSON

The Basic Practice of Statistics
Statistics
ISBN:
9781319042578
Author:
David S. Moore, William I. Notz, Michael A. Fligner
Publisher:
W. H. Freeman

Introduction to the Practice of Statistics
Statistics
ISBN:
9781319013387
Author:
David S. Moore, George P. McCabe, Bruce A. Craig
Publisher:
W. H. Freeman