At December 31 Assets Cash Accounts receivable, net Merchandise inventory Prepaid expenses Plant assets, net Total assets Liabilities and Equity Accounts payable Long-term notes payable Common stock, $10 par value Retained earnings Total liabilities and equity Current Year Earnings per share $ 26,053 77,051 95,908 8,732 242,846 $ 450,590 $ 113,319. 87, 252 162,500 87,519 $ 450, 590 Current Year 1 Year Ago 2 Years Ago $31, 386 54,925 69,706 7,994 224, 429 $388,440 $ 357, 318 181, 588 9,958 7,615 $ 66, 303 89, 341 162,500 70, 296 $ 388,440 The company's income statements for the current year and one year ago, follow. 1 Year Ago For Year Ended December 31 Sales Cost of goods sold Other operating expenses Interest expense Income tax expense Total costs and expenses Net income $ 585, 767 $ 31,085 43, 156 556, 479 $ 29, 288 $ 1.80 46,425 3,596 199, 438 $323, 700 $ 42,728 70, 822 162,500 47,650 $ 323, 700 $ 300, 459 116, 948 10, 632 6,934 $ 462,244 434,973 $ 27,271 $ 1.68
At December 31 Assets Cash Accounts receivable, net Merchandise inventory Prepaid expenses Plant assets, net Total assets Liabilities and Equity Accounts payable Long-term notes payable Common stock, $10 par value Retained earnings Total liabilities and equity Current Year Earnings per share $ 26,053 77,051 95,908 8,732 242,846 $ 450,590 $ 113,319. 87, 252 162,500 87,519 $ 450, 590 Current Year 1 Year Ago 2 Years Ago $31, 386 54,925 69,706 7,994 224, 429 $388,440 $ 357, 318 181, 588 9,958 7,615 $ 66, 303 89, 341 162,500 70, 296 $ 388,440 The company's income statements for the current year and one year ago, follow. 1 Year Ago For Year Ended December 31 Sales Cost of goods sold Other operating expenses Interest expense Income tax expense Total costs and expenses Net income $ 585, 767 $ 31,085 43, 156 556, 479 $ 29, 288 $ 1.80 46,425 3,596 199, 438 $323, 700 $ 42,728 70, 822 162,500 47,650 $ 323, 700 $ 300, 459 116, 948 10, 632 6,934 $ 462,244 434,973 $ 27,271 $ 1.68

Intermediate Accounting: Reporting And Analysis
3rd Edition
ISBN:9781337788281
Author:James M. Wahlen, Jefferson P. Jones, Donald Pagach
Publisher:James M. Wahlen, Jefferson P. Jones, Donald Pagach
Chapter7: Inventories: Cost Measurement And Flow Assumptions
Section: Chapter Questions
Problem 9RE: RE7-8 Johnson Company uses a perpetual inventory system. On October 23, Johnson purchased 100,000 of...

Related questions
Question
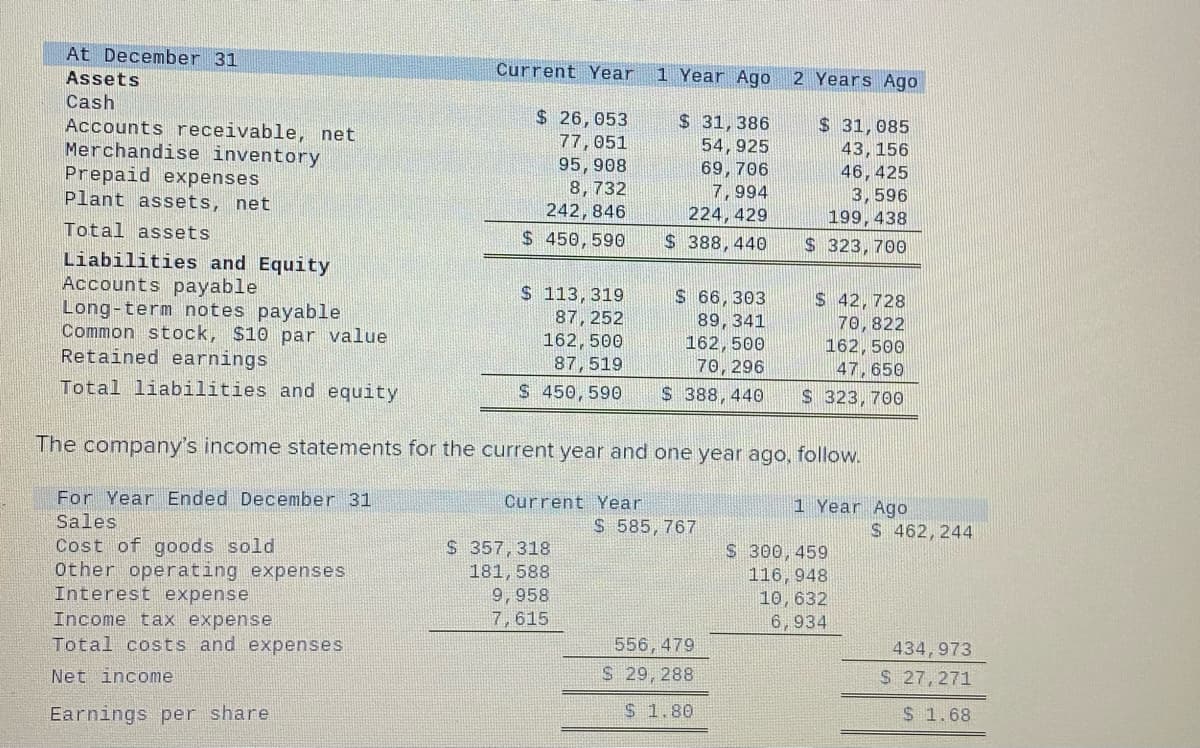
Transcribed Image Text:At December 31
Assets
Cash
Accounts receivable, net
Merchandise inventory
Prepaid expenses
Plant assets, net
Total assets
Liabilities and Equity
Accounts payable
Long-term notes payable
Common stock, $10 par value
Retained earnings
Total liabilities and equity
Cost of goods sold
Other operating expenses
Current Year
$ 26,053
77,051
95, 908
8, 732
242,846
$ 450, 590
Interest expense
Income tax expense
Total costs and expenses
Net income
Earnings per share
1 Year Ago
Current Year
$ 31, 386
54, 925
69, 706
$ 66,303
$ 113, 319
87, 252
162, 500
87, 519
89, 341
162,500
70, 296
$ 450, 590 $ 388, 440
$ 357, 318
181, 588
9,958
7,615
7,994
224, 429
388, 440
The company's income statements for the current year and one year ago, follow.
1 Year Ago
For Year Ended December 31
Sales
$ 585, 767
2 Years Ago
556, 479
S 29, 288
$ 1.80
$31, 085
43, 156
46,425
3,596
199, 438
$ 323, 700
$ 42,728
70, 822
162,500
47,650
$ 323, 700
$ 300, 459
116, 948
10, 632
6,934
$ 462,244
434,973
$ 27,271
$ 1.68
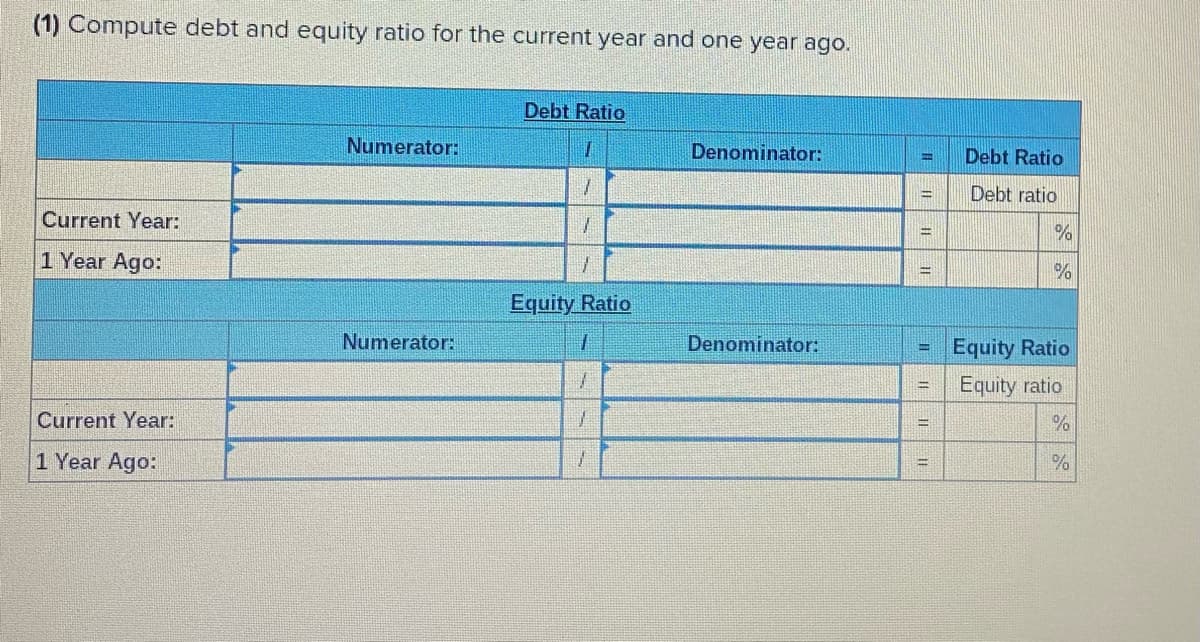
Transcribed Image Text:(1) Compute debt and equity ratio for the current year and one year ago.
Current Year:
1 Year Ago:
Current Year:
1 Year Ago:
Numerator:
Numerator:
Debt Ratio
1
1
1
1
Equity Ratio
1
1
1
1
Denominator:
Denominator:
B
www
=
Debt Ratio
Debt ratio
%
%
Equity Ratio
Equity ratio
%
%
Expert Solution
This question has been solved!
Explore an expertly crafted, step-by-step solution for a thorough understanding of key concepts.

Step by step
Solved in 2 steps with 2 images

Knowledge Booster


Learn more about
Need a deep-dive on the concept behind this application? Look no further. Learn more about this topic, accounting and related others by exploring similar questions and additional content below.Recommended textbooks for you
Intermediate Accounting: Reporting And Analysis
Accounting
ISBN:
9781337788281
Author:
James M. Wahlen, Jefferson P. Jones, Donald Pagach
Publisher:
Cengage Learning

Principles of Accounting Volume 1
Accounting
ISBN:
9781947172685
Author:
OpenStax
Publisher:
OpenStax College

Financial And Managerial Accounting
Accounting
ISBN:
9781337902663
Author:
WARREN, Carl S.
Publisher:
Cengage Learning,
Intermediate Accounting: Reporting And Analysis
Accounting
ISBN:
9781337788281
Author:
James M. Wahlen, Jefferson P. Jones, Donald Pagach
Publisher:
Cengage Learning
Principles of Accounting Volume 1
Accounting
ISBN:
9781947172685
Author:
OpenStax
Publisher:
OpenStax College
Financial And Managerial Accounting
Accounting
ISBN:
9781337902663
Author:
WARREN, Carl S.
Publisher:
Cengage Learning,

Financial Accounting
Accounting
ISBN:
9781337272124
Author:
Carl Warren, James M. Reeve, Jonathan Duchac
Publisher:
Cengage Learning
Century 21 Accounting Multicolumn Journal
Accounting
ISBN:
9781337679503
Author:
Gilbertson
Publisher:
Cengage

Survey of Accounting (Accounting I)
Accounting
ISBN:
9781305961883
Author:
Carl Warren
Publisher:
Cengage Learning