At the 0.05 significance level, test the claim for the modified components, the mean time, between failures is greater than 520 hours.
At the 0.05 significance level, test the claim for the modified components, the mean time, between failures is greater than 520 hours.

MATLAB: An Introduction with Applications
6th Edition
ISBN:9781119256830
Author:Amos Gilat
Publisher:Amos Gilat
Chapter1: Starting With Matlab
Section: Chapter Questions
Problem 1P

Related questions
Question
100%
At the 0.05 significance level, test the claim for the modified components, the
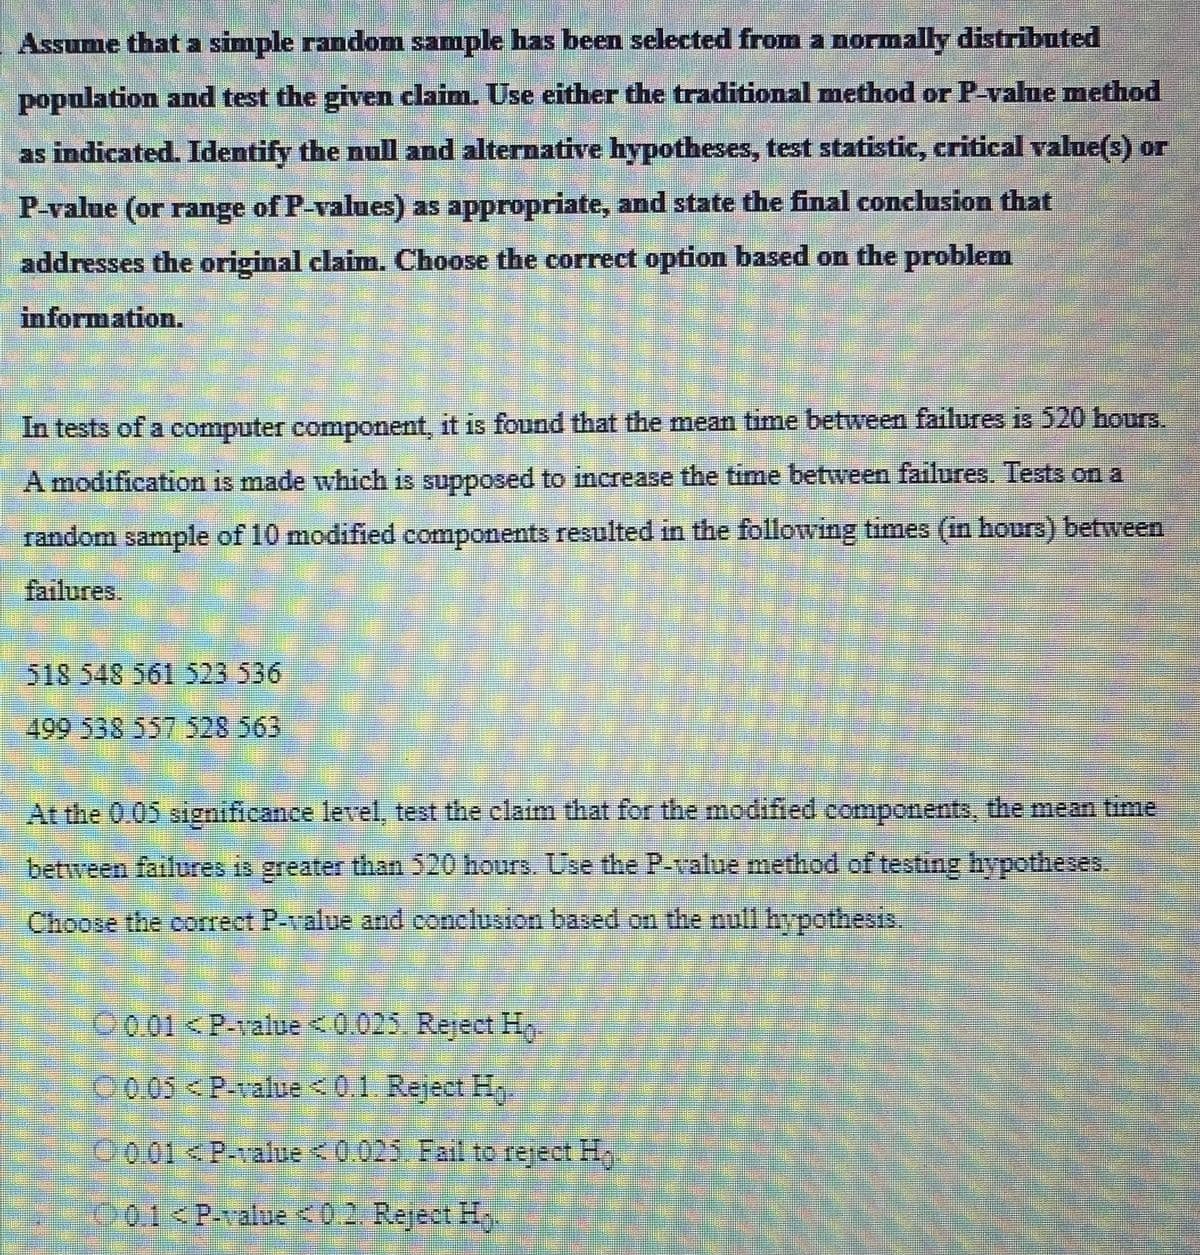
Transcribed Image Text:Assume that a simple random sample has been selected from a normally distributed
population and test the given claim. Use either the traditional method or P-value method
as indicated. Identify the null and alternative hypotheses, test statistic, critical value(s) or
P-value (or range of P-values) as appropriate, and state the final conclusion that
addresses the original claim. Choose the correct option based on the problem
information.
In tests of a computer component, it is found that the mean time between failures is 520 hours.
A modification is made which is supposed to increase the time between failures. Tests on a
random sample of 10 modified components resulted in the following times (in hours) between
failures.
518 548 561 523 536
499 538 557 528 563
5
At the 0.05 significance level, test the claim that for the modified components, the mean time
between failures is greater than 520 hours. Use the P-value method of testing hypotheses.
Choose the correct P-value and conclusion based on the null hypothesis
0.01 < P-value <0.025. Reject H
00.05 < P-value <0.1. Reject H₂
00.01 < P-value < 0.025. Fail to reject H
0.1 < P-value <0.2. Reject Ho.
Expert Solution
This question has been solved!
Explore an expertly crafted, step-by-step solution for a thorough understanding of key concepts.

This is a popular solution!

Trending now
This is a popular solution!

Step by step
Solved in 4 steps with 4 images

Recommended textbooks for you
MATLAB: An Introduction with Applications
Statistics
ISBN:
9781119256830
Author:
Amos Gilat
Publisher:
John Wiley & Sons Inc

Probability and Statistics for Engineering and th…
Statistics
ISBN:
9781305251809
Author:
Jay L. Devore
Publisher:
Cengage Learning

Statistics for The Behavioral Sciences (MindTap C…
Statistics
ISBN:
9781305504912
Author:
Frederick J Gravetter, Larry B. Wallnau
Publisher:
Cengage Learning
MATLAB: An Introduction with Applications
Statistics
ISBN:
9781119256830
Author:
Amos Gilat
Publisher:
John Wiley & Sons Inc
Probability and Statistics for Engineering and th…
Statistics
ISBN:
9781305251809
Author:
Jay L. Devore
Publisher:
Cengage Learning
Statistics for The Behavioral Sciences (MindTap C…
Statistics
ISBN:
9781305504912
Author:
Frederick J Gravetter, Larry B. Wallnau
Publisher:
Cengage Learning

Elementary Statistics: Picturing the World (7th E…
Statistics
ISBN:
9780134683416
Author:
Ron Larson, Betsy Farber
Publisher:
PEARSON

The Basic Practice of Statistics
Statistics
ISBN:
9781319042578
Author:
David S. Moore, William I. Notz, Michael A. Fligner
Publisher:
W. H. Freeman

Introduction to the Practice of Statistics
Statistics
ISBN:
9781319013387
Author:
David S. Moore, George P. McCabe, Bruce A. Craig
Publisher:
W. H. Freeman