ata on 12 randomly selected athletes was obtained concerning their cardiovascular fitness (measured by ime to exhaustion running on a treadmill) and performance in a 20-km ski race. Both variables were measured in minutes and a regression analysis was performed. ki = 85 — 2.5 · treadmill Coefficients Estimate (Intercept) Treadmill 85 -2.5 Std. Error 0.45 1 there sufficient evidence to conclude that there is a linear relationship between cardiovascular fitness nd ski race performance? Round your answers to three decimal places. What is the test statistic?
ata on 12 randomly selected athletes was obtained concerning their cardiovascular fitness (measured by ime to exhaustion running on a treadmill) and performance in a 20-km ski race. Both variables were measured in minutes and a regression analysis was performed. ki = 85 — 2.5 · treadmill Coefficients Estimate (Intercept) Treadmill 85 -2.5 Std. Error 0.45 1 there sufficient evidence to conclude that there is a linear relationship between cardiovascular fitness nd ski race performance? Round your answers to three decimal places. What is the test statistic?

Linear Algebra: A Modern Introduction
4th Edition
ISBN:9781285463247
Author:David Poole
Publisher:David Poole
Chapter7: Distance And Approximation
Section7.3: Least Squares Approximation
Problem 31EQ

Related questions
Question
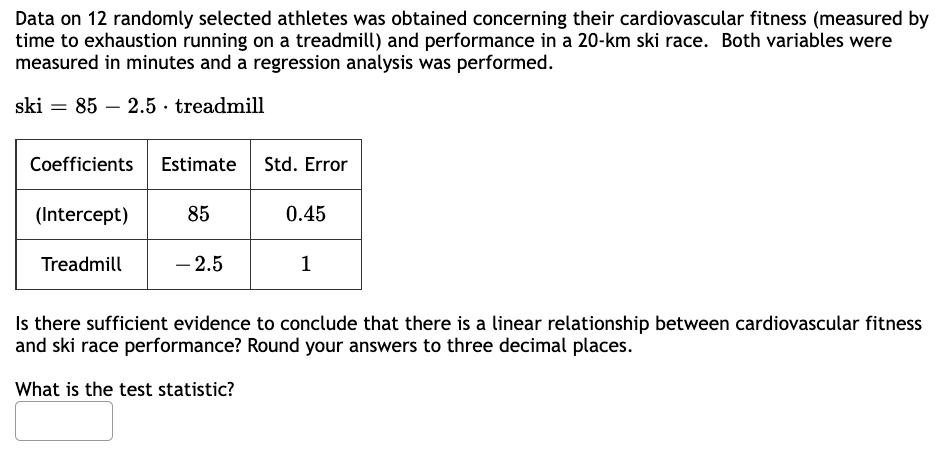
Transcribed Image Text:Data on 12 randomly selected athletes was obtained concerning their cardiovascular fitness (measured by
time to exhaustion running on a treadmill) and performance in a 20-km ski race. Both variables were
measured in minutes and a regression analysis was performed.
ski 85 2.5 treadmill
=
Coefficients Estimate
(Intercept)
Treadmill
85
- 2.5
Std. Error
0.45
1
Is there sufficient evidence to conclude that there is a linear relationship between cardiovascular fitness
and ski race performance? Round your answers to three decimal places.
What is the test statistic?
Expert Solution
This question has been solved!
Explore an expertly crafted, step-by-step solution for a thorough understanding of key concepts.

Step by step
Solved in 2 steps

Recommended textbooks for you
Linear Algebra: A Modern Introduction
Algebra
ISBN:
9781285463247
Author:
David Poole
Publisher:
Cengage Learning

Glencoe Algebra 1, Student Edition, 9780079039897…
Algebra
ISBN:
9780079039897
Author:
Carter
Publisher:
McGraw Hill

College Algebra
Algebra
ISBN:
9781305115545
Author:
James Stewart, Lothar Redlin, Saleem Watson
Publisher:
Cengage Learning
Linear Algebra: A Modern Introduction
Algebra
ISBN:
9781285463247
Author:
David Poole
Publisher:
Cengage Learning
Glencoe Algebra 1, Student Edition, 9780079039897…
Algebra
ISBN:
9780079039897
Author:
Carter
Publisher:
McGraw Hill
College Algebra
Algebra
ISBN:
9781305115545
Author:
James Stewart, Lothar Redlin, Saleem Watson
Publisher:
Cengage Learning

Big Ideas Math A Bridge To Success Algebra 1: Stu…
Algebra
ISBN:
9781680331141
Author:
HOUGHTON MIFFLIN HARCOURT
Publisher:
Houghton Mifflin Harcourt