Two different simple random samples are drawn from two different populations. The first sample consists of 30 people with 15 having a common attribute. The second sample consists of 2000 people with 1426 of them having the same common attribute. Compare the results from a hypothesis test of p₁ = P₂ (with a 0.05 significance level) and a 95% confidence interval estimate of P₁-P2- What are the null and alternative hypotheses for the hypothesis test? OA. Ho: P1 P2 H₁: P₁ P2 1 OD. Ho: P12P2 H₁: P₁ P2 Identify the test statistic. (Round to two decimal places as needed.). OB. Ho: P1 P2 H₁: P₁ P2 OE. Ho: P1 P2 H₁: P1 P2 1 c. Ho: P1 P2 H₁: P₁ P2 OF. Ho: P1 P₂ H₁: P₁ P2
Two different simple random samples are drawn from two different populations. The first sample consists of 30 people with 15 having a common attribute. The second sample consists of 2000 people with 1426 of them having the same common attribute. Compare the results from a hypothesis test of p₁ = P₂ (with a 0.05 significance level) and a 95% confidence interval estimate of P₁-P2- What are the null and alternative hypotheses for the hypothesis test? OA. Ho: P1 P2 H₁: P₁ P2 1 OD. Ho: P12P2 H₁: P₁ P2 Identify the test statistic. (Round to two decimal places as needed.). OB. Ho: P1 P2 H₁: P₁ P2 OE. Ho: P1 P2 H₁: P1 P2 1 c. Ho: P1 P2 H₁: P₁ P2 OF. Ho: P1 P₂ H₁: P₁ P2

MATLAB: An Introduction with Applications
6th Edition
ISBN:9781119256830
Author:Amos Gilat
Publisher:Amos Gilat
Chapter1: Starting With Matlab
Section: Chapter Questions
Problem 1P

Related questions
Question
9.1 Q10
need test statistic
p value
conclusion of the hypothesis and the % interval
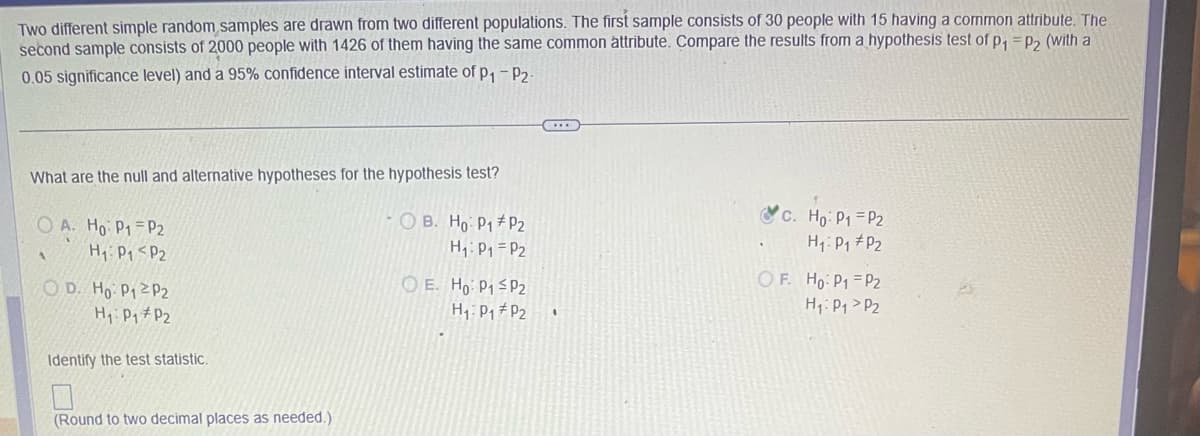
Transcribed Image Text:Two different simple random samples are drawn from two different populations. The first sample consists of 30 people with 15 having a common attribute. The
second sample consists of 2000 people with 1426 of them having the same common attribute. Compare the results from a hypothesis test of p₁ = P₂ (with a
0.05 significance level) and a 95% confidence interval estimate of P₁ P2
What are the null and alternative hypotheses for the hypothesis test?
OB. Ho P₁ P2
OA. Ho: P1 P2
H₁: P₁
P2
H₁: P1 P2
OD. Ho: P₁2P2
H₁: P₁ P2
Identify the test statistic.
(Round to two decimal places as needed.)
OE. Ho: P₁ P2
H₁: P₁ P2
1
c. Ho: P1 = P2
H₁: P₁ P2
OF. Ho: P₁
H₁: P₁
P2
P2
Expert Solution
This question has been solved!
Explore an expertly crafted, step-by-step solution for a thorough understanding of key concepts.

This is a popular solution!

Trending now
This is a popular solution!

Step by step
Solved in 2 steps with 3 images

Recommended textbooks for you
MATLAB: An Introduction with Applications
Statistics
ISBN:
9781119256830
Author:
Amos Gilat
Publisher:
John Wiley & Sons Inc

Probability and Statistics for Engineering and th…
Statistics
ISBN:
9781305251809
Author:
Jay L. Devore
Publisher:
Cengage Learning

Statistics for The Behavioral Sciences (MindTap C…
Statistics
ISBN:
9781305504912
Author:
Frederick J Gravetter, Larry B. Wallnau
Publisher:
Cengage Learning
MATLAB: An Introduction with Applications
Statistics
ISBN:
9781119256830
Author:
Amos Gilat
Publisher:
John Wiley & Sons Inc
Probability and Statistics for Engineering and th…
Statistics
ISBN:
9781305251809
Author:
Jay L. Devore
Publisher:
Cengage Learning
Statistics for The Behavioral Sciences (MindTap C…
Statistics
ISBN:
9781305504912
Author:
Frederick J Gravetter, Larry B. Wallnau
Publisher:
Cengage Learning

Elementary Statistics: Picturing the World (7th E…
Statistics
ISBN:
9780134683416
Author:
Ron Larson, Betsy Farber
Publisher:
PEARSON

The Basic Practice of Statistics
Statistics
ISBN:
9781319042578
Author:
David S. Moore, William I. Notz, Michael A. Fligner
Publisher:
W. H. Freeman

Introduction to the Practice of Statistics
Statistics
ISBN:
9781319013387
Author:
David S. Moore, George P. McCabe, Bruce A. Craig
Publisher:
W. H. Freeman