ata was gathered showing the average annual salary ($1,000s) and the average retirement age for a variety of jobs. Average Annual Salary ($1,000s) Average Retirement Age (years) O Art directors Astronomers Audiologists Dental hygienists Economists Engineers Law teachers Optometrists Job Political scientists Urban and regional planners 70 65 60+ 55- 50 81 . 96 70 70 92 92 100 98 102 65 60 70 80 90 100 110 Average Annual Salary ($1,000s) (a) Develop a scatter diagram for these data with average annual salary as the independent variable. 75 T 75 69.0 61.0 60 67.5 72.3 55 63.3 69.5 61.8 65.5 60.1 69.0 70- 65 50 60 80 90 100 110 Average Annual Salary ($1,000s) 70 75 70 65 60 55 50 What does the scatter diagram indicate about the relationship between the two variables? O There appears to be no noticeable relationship between average annual salary ($1,000s) and average retirement age (years). O There appears to be a negative linear relationship between average annual salary ($1,000s) and average retirement age (years). O There appears to be a positive linear relationship between average annual salary ($1,000s) and average retirement age (years). 60 70 80 90 100 Average Annual Salary ($1,000s) 110 75 70 65- 60 55 50 60 80 90 100 110 Average Annual Salary ($1,000s) 70 (b) Use these data to develop an estimated regression equation that can be used to predict average retirement age (years) given the average annual salary (in $1,000s). (Round your numerical values to three decimal places). ý= @
ata was gathered showing the average annual salary ($1,000s) and the average retirement age for a variety of jobs. Average Annual Salary ($1,000s) Average Retirement Age (years) O Art directors Astronomers Audiologists Dental hygienists Economists Engineers Law teachers Optometrists Job Political scientists Urban and regional planners 70 65 60+ 55- 50 81 . 96 70 70 92 92 100 98 102 65 60 70 80 90 100 110 Average Annual Salary ($1,000s) (a) Develop a scatter diagram for these data with average annual salary as the independent variable. 75 T 75 69.0 61.0 60 67.5 72.3 55 63.3 69.5 61.8 65.5 60.1 69.0 70- 65 50 60 80 90 100 110 Average Annual Salary ($1,000s) 70 75 70 65 60 55 50 What does the scatter diagram indicate about the relationship between the two variables? O There appears to be no noticeable relationship between average annual salary ($1,000s) and average retirement age (years). O There appears to be a negative linear relationship between average annual salary ($1,000s) and average retirement age (years). O There appears to be a positive linear relationship between average annual salary ($1,000s) and average retirement age (years). 60 70 80 90 100 Average Annual Salary ($1,000s) 110 75 70 65- 60 55 50 60 80 90 100 110 Average Annual Salary ($1,000s) 70 (b) Use these data to develop an estimated regression equation that can be used to predict average retirement age (years) given the average annual salary (in $1,000s). (Round your numerical values to three decimal places). ý= @

Linear Algebra: A Modern Introduction
4th Edition
ISBN:9781285463247
Author:David Poole
Publisher:David Poole
Chapter4: Eigenvalues And Eigenvectors
Section4.6: Applications And The Perron-frobenius Theorem
Problem 22EQ

Related questions
Question
part d dropdown: at least .55 or less than .55
did not provide or provided
should or should not
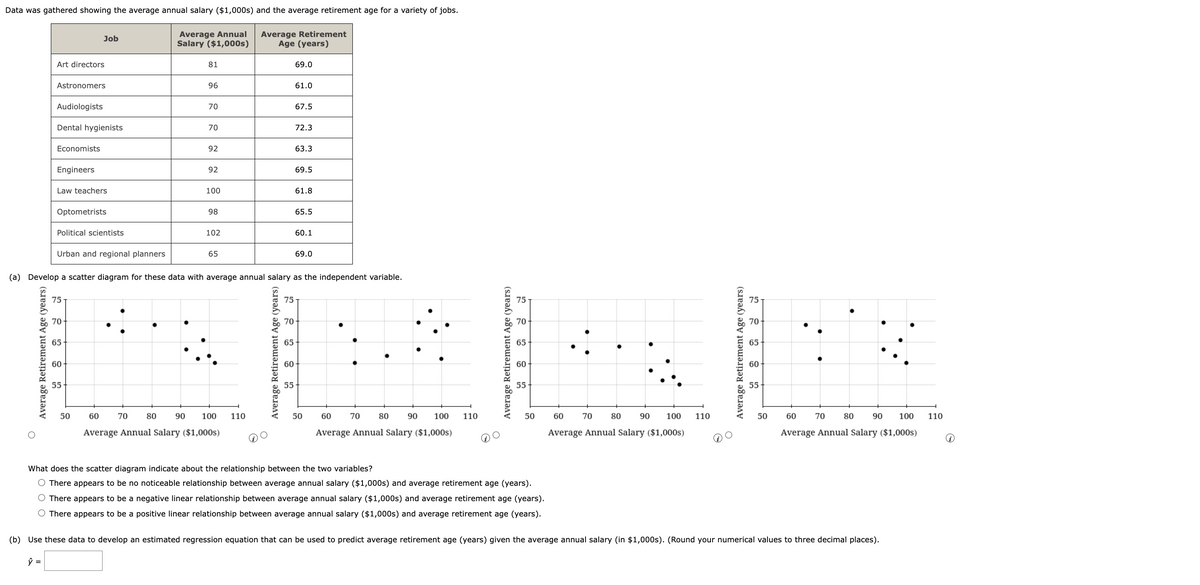
Transcribed Image Text:Data was gathered showing the average annual salary ($1,000s) and the average retirement age for a variety of jobs.
Average Annual
Salary ($1,000s)
Average Retirement Age (years)
Art directors
Astronomers
Audiologists
Dental hygienists
Economists
Engineers
Law teachers
Optometrists
Political scientists
Job
75
70
65
60
55
50
60
70
81
80
96
70
70
92
92
100
98
102
Urban and regional planners
(a) Develop a scatter diagram for these data with average annual salary as the independent variable.
65
90 100 110
Average Retirement
Age (years)
Average Annual Salary ($1,000s)
75
70
65
60
69.0
55
61.0
67.5
72.3
63.3
69.5
61.8
65.5
60.1
69.0
50
70
60
80 90 100
Average Annual Salary ($1,000s)
110
75
70
65
60
55
50
What does the scatter diagram indicate about the relationship between the two variables?
O There appears to be no noticeable relationship between average annual salary ($1,000s) and average retirement age (years).
O There appears to be a negative linear relationship between average annual salary ($1,000s) and average retirement age (years).
O There appears to be a positive linear relationship between average annual salary ($1,000s) and average retirement age (years).
60
90 100
Average Annual Salary ($1,000s)
70
80
110
75
70
65
60
55
50
70
60
90 100
Average Annual Salary ($1,000s)
80
(b) Use these data to develop an estimated regression equation that can be used to predict average retirement age (years) given the average annual salary (in $1,000s). (Round your numerical values to three decimal places).
ŷ =
110
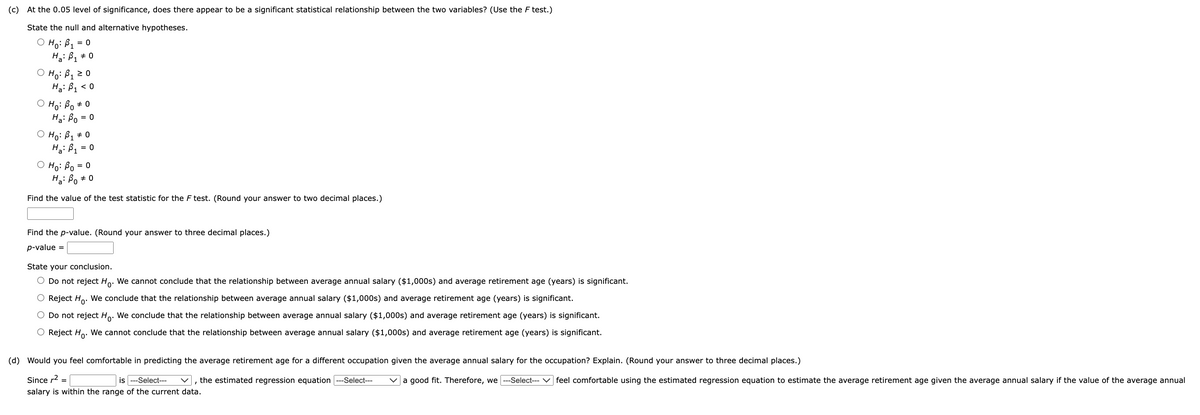
Transcribed Image Text:(c) At the 0.05 level of significance, does there appear to be a significant statistical relationship between the two variables? (Use the F test.)
State the null and alternative hypotheses.
O Ho: ³₁
Ha: B₁ * 0
#
O Ho: B₁ ≥ 0
Ha: B₁ <0
= 0
ọ Hoi Bo #0
Ha: Bo = 0
Ho: B₁ * 0
Ha: B₁
Ọ Ho: Bo
H
a'
= 0
= 0
#0
Find the value of the test statistic for the F test. (Round your answer to two decimal places.)
Find the p-value. (Round your answer to three decimal places.)
p-value =
State your conclusion.
O Do not reject Ho. We cannot conclude that the relationship between average annual salary ($1,000s) and average retirement age (years) is significant.
O Reject Ho. We conclude that the relationship between average annual salary ($1,000s) and average retirement age (years) is significant.
O Do not reject Ho. We conclude that the relationship between average annual salary ($1,000s) and average retirement age (years) is significant.
Reject Ho. We cannot conclude that the relationship between average annual salary ($1,000s) and average retirement age (years) is significant.
(d) Would you feel comfortable in predicting the average retirement age for a different occupation given the average annual salary for the occupation? Explain. (Round your answer to three decimal places.)
Since r² =
is ---Select---
, the estimated regression equation --Select---
salary is within the range of the current data.
a good fit. Therefore, we ---Select--- ✓ feel comfortable using the estimated regression equation to estimate the average retirement age given the average annual salary if the value of the average annual
Expert Solution
This question has been solved!
Explore an expertly crafted, step-by-step solution for a thorough understanding of key concepts.

This is a popular solution!

Trending now
This is a popular solution!

Step by step
Solved in 3 steps with 4 images

Recommended textbooks for you
Linear Algebra: A Modern Introduction
Algebra
ISBN:
9781285463247
Author:
David Poole
Publisher:
Cengage Learning

College Algebra (MindTap Course List)
Algebra
ISBN:
9781305652231
Author:
R. David Gustafson, Jeff Hughes
Publisher:
Cengage Learning
Linear Algebra: A Modern Introduction
Algebra
ISBN:
9781285463247
Author:
David Poole
Publisher:
Cengage Learning
College Algebra (MindTap Course List)
Algebra
ISBN:
9781305652231
Author:
R. David Gustafson, Jeff Hughes
Publisher:
Cengage Learning