
Chapter11: The Firm: Production And Costs
Section: Chapter Questions
Problem 21P

Related questions
Question
100%
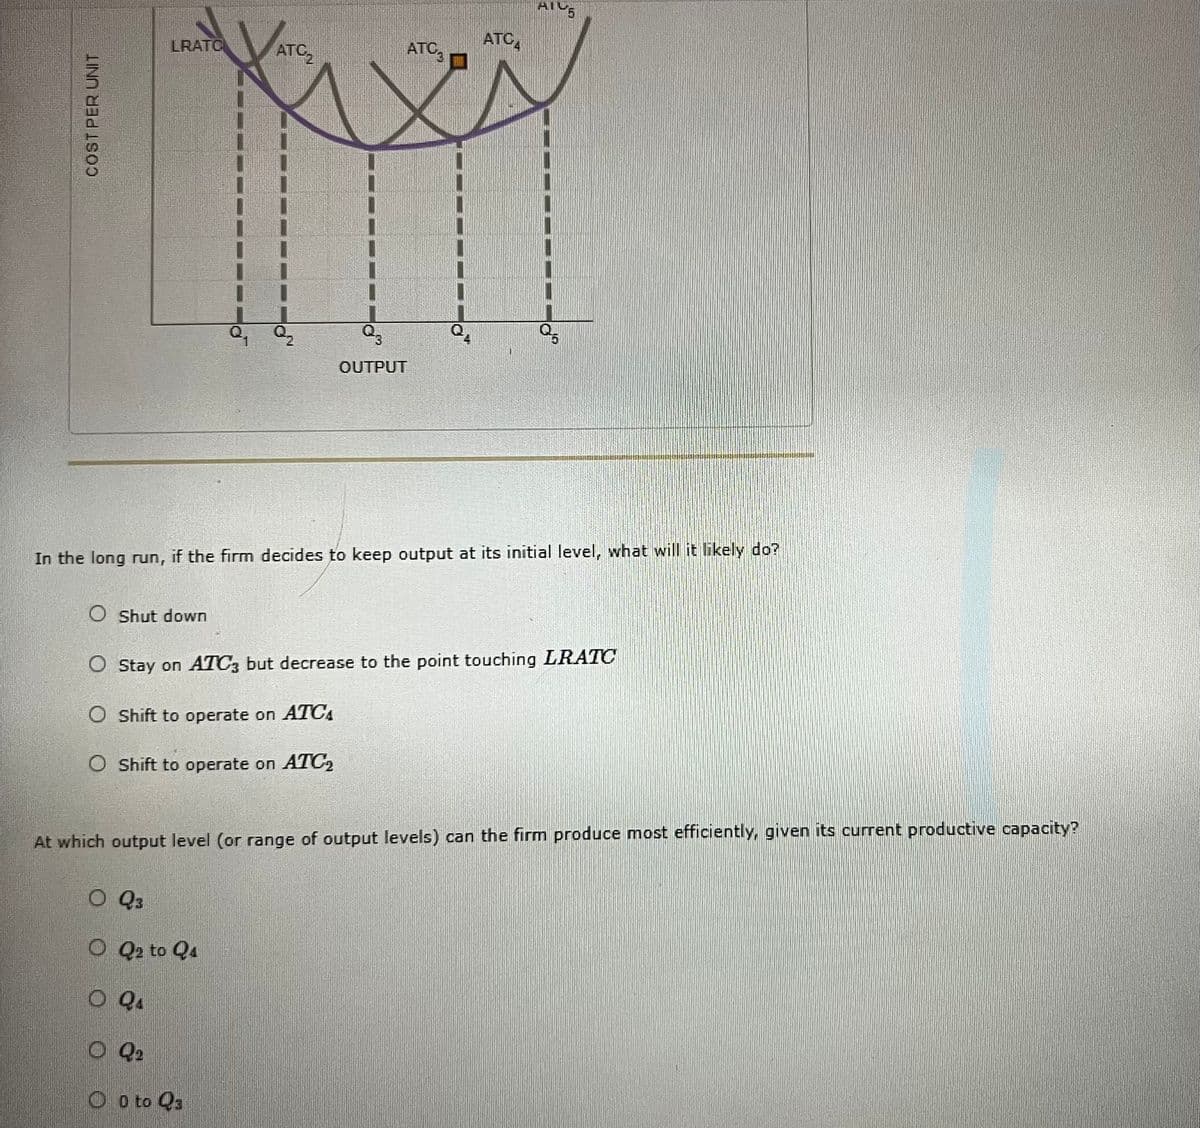
Transcribed Image Text:LRATO
ATC
ATC,
ATC,
OUTPUT
In the long run, if the firm decides to keep output at its initial level, what will it likely do?
O Shut down
O Stay on ATC3 but decrease to the point touching LRATC
O Shift to operate on ATC4
O Shift to operate on ATC2
At which output level (or range of output levels) can the firm produce most efficiently, given its current productive capacity?
O Q3
O Q2 to Q4
O Q4
O Q2
O o to Q3
COST PER UNIT
Transcribed Image Text:The following graph shows the short-run average total cost curves for different plant sizes and the long-run average total cost curve for a publishing
firm. The five marked quantities indicate points of tangency between each short-run average total cost (ATC) curve and the long-run average total
cost (LRATC) curve; for example, Q1 marks the point of tangency between ATC, and LRATC.
The orange point on ATC3 indicates the firm's current output level in the short run (Q.).
ATC,
ATC
LRATC
ATC
ATC,
ATC,
OUTPUT
In the long run, if the firm decides to keep output at its initial level, what will it likely do?
O Shut down
O Stay on ATC3 but decrease to the point touching LRATC
O Shift to operate on ATC4
O Shift to operate on ATC2
COST PER UNIT
Expert Solution
This question has been solved!
Explore an expertly crafted, step-by-step solution for a thorough understanding of key concepts.

Step by step
Solved in 2 steps

Knowledge Booster


Learn more about
Need a deep-dive on the concept behind this application? Look no further. Learn more about this topic, economics and related others by exploring similar questions and additional content below.Recommended textbooks for you
Exploring Economics
Economics
ISBN:
9781544336329
Author:
Robert L. Sexton
Publisher:
SAGE Publications, Inc

Principles of Economics 2e
Economics
ISBN:
9781947172364
Author:
Steven A. Greenlaw; David Shapiro
Publisher:
OpenStax

Exploring Economics
Economics
ISBN:
9781544336329
Author:
Robert L. Sexton
Publisher:
SAGE Publications, Inc
Principles of Economics 2e
Economics
ISBN:
9781947172364
Author:
Steven A. Greenlaw; David Shapiro
Publisher:
OpenStax

