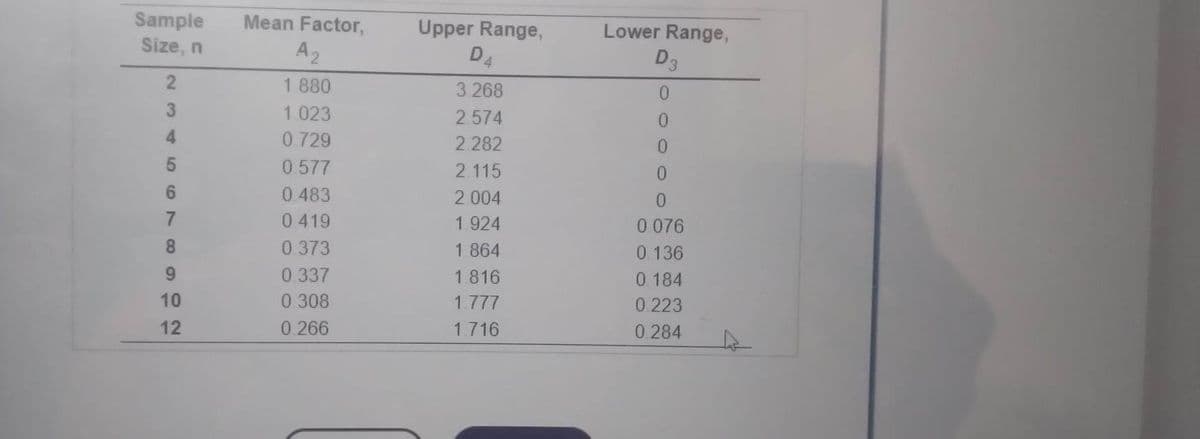
Auto pistons at Wemming Chung's plant in Shanghai are produced in a forging process, and the diameter is a critical factor that must be controlled. From sample sizes of 10 pistons produced each day, the mean and the range of this diameter have been as follows: Day Mean x (mm) Range R (mm) 1 156.9 4.4 2 155.2 4.4 3 155.6 4.3 4 153.5 4.8 5 156.6 4.7 Part 2 a) What is the value of x? x= _______ mm (round your response to two decimal places). b) What is the value of Upper R overbarR ? Upper R overbarRequals= _______ mm (round your response to two decimal places). c) What are the UCL Subscript x overbarUCLx and LCL Subscript x overbarLCLx using 3-sigma ? Upper Control Limit (UCL Subscript x overbarUCLx ) = _________ mm (round your response to two decimal places). Lower Control Limit (LCL Subscript x overbarLCLx ) = ________ mm (round your response to two decimal places). d) What are the UCL Subscript Upper RUCLR and LCL Subscript Upper RLCLR using 3-sigma ? Upper Control Limit (UCL Subscript Upper RUCLR ) = __________ mm (round your response to two decimal places). Lower Control Limit (LCL Subscript Upper RLCLR ) = __________ mm (round your response to two decimal places). e) If the true diameter mean should be 155 mm and you want this as your center (nominal) line, what are the new UCL Subscript x overbarUCLx and LCL Subscript x overbarLCLx ? Upper Control Limit (UCL Subscript x overbarUCLx ) = _________ mm (round your response to two decimal places). Lower Control Limit (LCL Subscript x overbarLCLx ) = ________ mm (round your response to two decimal places).


4.
|
Day
|
Mean x
(mm)
|
Range R
(mm)
|
|
1
|
156.9
|
4.4
|
|
2
|
155.2
|
4.4
|
|
3
|
155.6
|
4.3
|
|
4
|
153.5
|
4.8
|
|
5
|
156.6
|
4.7
|
Part 2
b) What is the value of
Upper R overbarR ?
Upper R overbarRequals= _______ mm (round your response to two decimal places).
c) What are the
UCL Subscript x overbarUCLx and
LCL Subscript x overbarLCLx using 3-sigma ?
Upper Control Limit
(UCL Subscript x overbarUCLx )
= _________ mm (round your response to two decimal places).
Lower Control Limit
(LCL Subscript x overbarLCLx )
= ________ mm (round your response to two decimal places).
d) What are the UCL Subscript Upper RUCLR and LCL Subscript Upper RLCLR using 3-sigma ?
Upper Control Limit
(UCL Subscript Upper RUCLR )
= __________ mm (round your response to two decimal places).
Lower Control Limit
(LCL Subscript Upper RLCLR )
= __________ mm (round your response to two decimal places).
e) If the true diameter mean should be 155 mm and you want this as your center (nominal) line, what are the new
UCL Subscript x overbarUCLx
and LCL Subscript x overbarLCLx ?
Upper Control Limit
(UCL Subscript x overbarUCLx )
= _________ mm (round your response to two decimal places).
Lower Control Limit
(LCL Subscript x overbarLCLx )
= ________ mm (round your response to two decimal places).

Step by step
Solved in 3 steps with 5 images
