c. Prepare a naive forecast for periods 2 through 11 using the given sales data. Compute each of the following; (1) MSE, (2) MAD, (3) tracking signal at month 10, and (4) 2s control limits. (Negative values should be indicated by a minus sign. Round your answers to 2 decimal places.) MSE MAD Tracking signal Control limits 0+
c. Prepare a naive forecast for periods 2 through 11 using the given sales data. Compute each of the following; (1) MSE, (2) MAD, (3) tracking signal at month 10, and (4) 2s control limits. (Negative values should be indicated by a minus sign. Round your answers to 2 decimal places.) MSE MAD Tracking signal Control limits 0+

Practical Management Science
6th Edition
ISBN:9781337406659
Author:WINSTON, Wayne L.
Publisher:WINSTON, Wayne L.
Chapter13: Regression And Forecasting Models
Section13.3: Simple Regression Models
Problem 2P: The file P13_02.xlsx contains five years of monthly data on sales (number of units sold) for a...

Related questions
Question
Please assist me with this question.
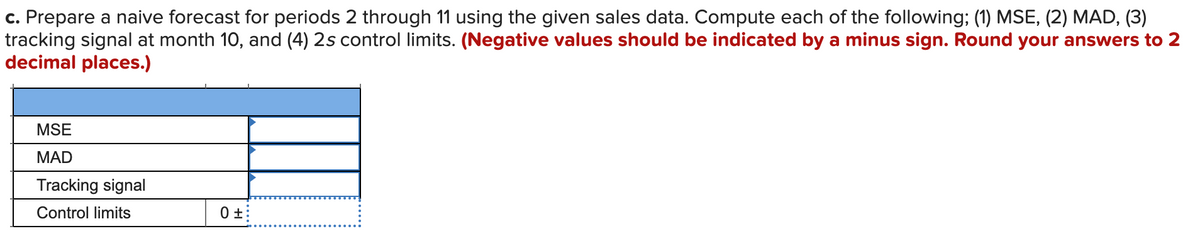
Transcribed Image Text:c. Prepare a naive forecast for periods 2 through 11 using the given sales data. Compute each of the following; (1) MSE, (2) MAD, (3)
tracking signal at month 10, and (4) 2s control limits. (Negative values should be indicated by a minus sign. Round your answers to 2
decimal places.)
MSE
MAD
Tracking signal
Control limits
0 ±:
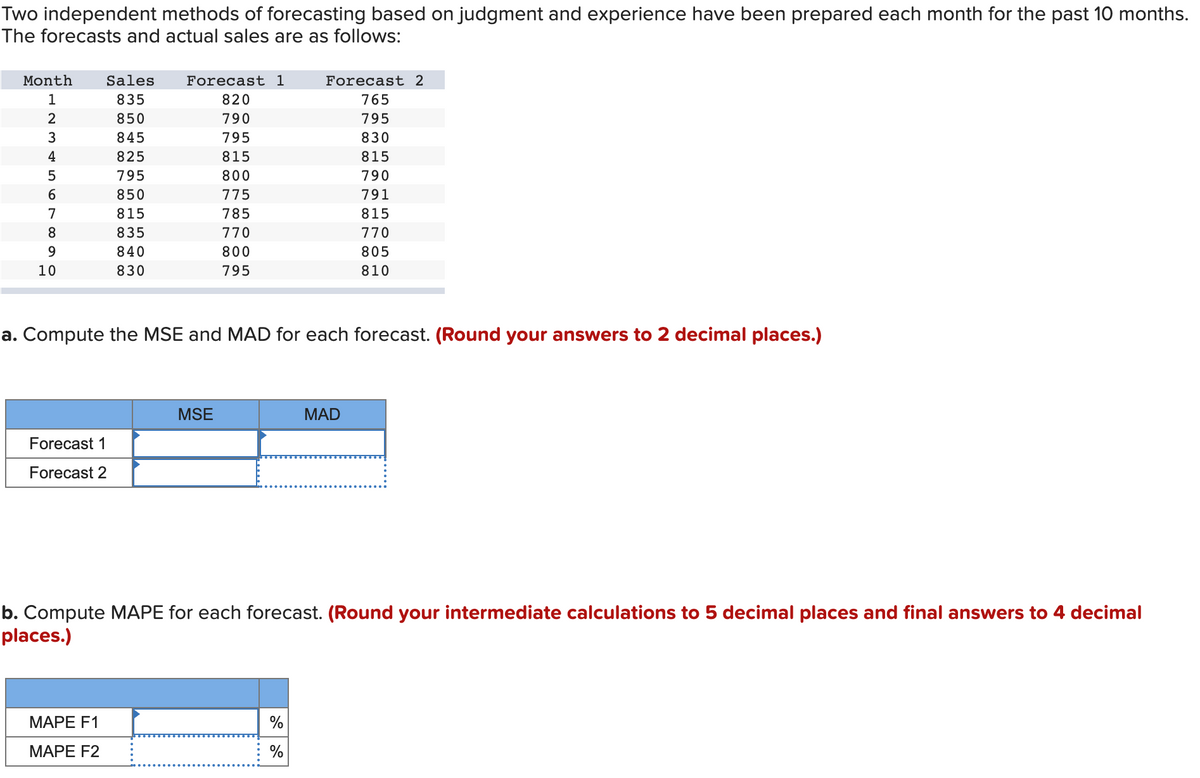
Transcribed Image Text:Two independent methods of forecasting based on judgment and experience have been prepared each month for the past 10 months.
The forecasts and actual sales are as follows:
Month
1
2
3
4
5
6
7
8
0090
10
Forecast 1
Forecast 2
Sales
835
850
845
825
795
850
815
835
840
830
Forecast 1
820
790
795
815
800
775
785
770
800
795
MAPE F1
MAPE F2
a. Compute the MSE and MAD for each forecast. (Round your answers to 2 decimal places.)
MSE
Forecast 2
765
795
830
%
%
815
790
791
815
770
805
810
MAD
b. Compute MAPE for each forecast. (Round your intermediate calculations to 5 decimal places and final answers to 4 decimal
places.)
Expert Solution
This question has been solved!
Explore an expertly crafted, step-by-step solution for a thorough understanding of key concepts.

Step by step
Solved in 2 steps with 4 images

Follow-up Questions
Read through expert solutions to related follow-up questions below.
Follow-up Question
the MAD turned out great however the MSE is off
Solution
Recommended textbooks for you
Practical Management Science
Operations Management
ISBN:
9781337406659
Author:
WINSTON, Wayne L.
Publisher:
Cengage,

Contemporary Marketing
Marketing
ISBN:
9780357033777
Author:
Louis E. Boone, David L. Kurtz
Publisher:
Cengage Learning

Marketing
Marketing
ISBN:
9780357033791
Author:
Pride, William M
Publisher:
South Western Educational Publishing
Practical Management Science
Operations Management
ISBN:
9781337406659
Author:
WINSTON, Wayne L.
Publisher:
Cengage,
Contemporary Marketing
Marketing
ISBN:
9780357033777
Author:
Louis E. Boone, David L. Kurtz
Publisher:
Cengage Learning
Marketing
Marketing
ISBN:
9780357033791
Author:
Pride, William M
Publisher:
South Western Educational Publishing