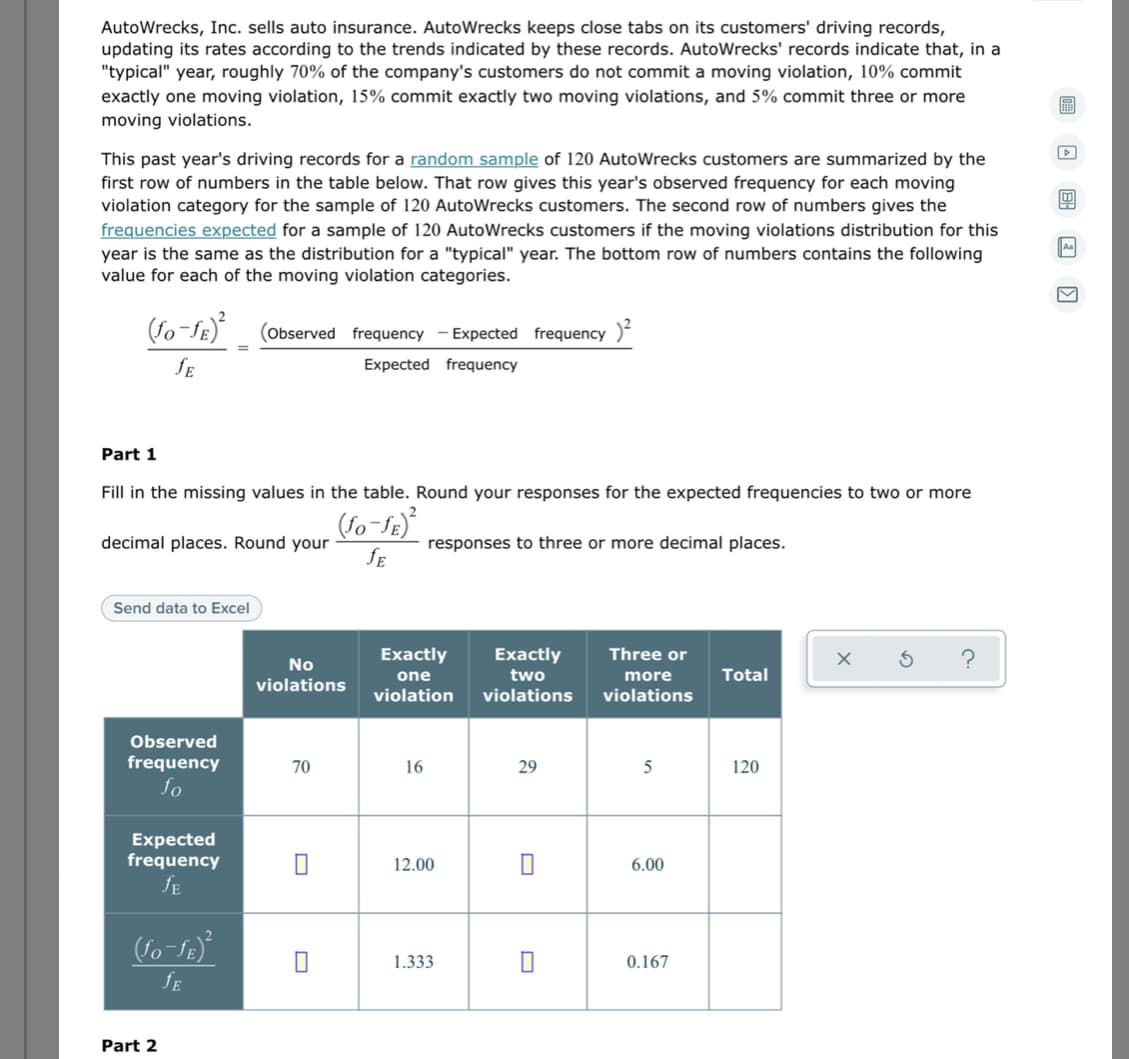
AutoWrecks, Inc. sells auto insurance. AutoWrecks keeps close tabs on its customers' driving records, updating its rates according to the trends indicated by these records. AutoWrecks' records indicate that, in a "typical" year, roughly 70% of the company's customers do not commit a moving violation, 10% commit exactly one moving violation, 15% commit exactly two moving violations, and 5% commit three or more moving violations. This past year's driving records for a random sample of 120 AutoWrecks customers are summarized by the first row of numbers in the table below. That row gives this year's observed frequency for each moving violation category for the sample of 120 AutoWrecks customers. The second row of numbers gives the frequencies expected for a sample of 120 AutoWrecks customers if the moving violations distribution for this year is the same as the distribution for a "typical" year. The bottom row of numbers contains the following value for each of the moving violation categories. (Observed frequency - Expected frequency )* SE Expected frequency Part 1 Fill in the missing values in the table. Round your responses for the expected frequencies to two or more decimal places. Round your responses to three or more decimal places. fE Send data to Excel Exactly two Exactly Three or No one more Total violations violation violations violations Observed frequency 70 16 29 120 fo Expected frequency fE 12.00 6.00 1.333 0.167 fE Rart ?
AutoWrecks, Inc. sells auto insurance. AutoWrecks keeps close tabs on its customers' driving records, updating its rates according to the trends indicated by these records. AutoWrecks' records indicate that, in a "typical" year, roughly 70% of the company's customers do not commit a moving violation, 10% commit exactly one moving violation, 15% commit exactly two moving violations, and 5% commit three or more moving violations. This past year's driving records for a random sample of 120 AutoWrecks customers are summarized by the first row of numbers in the table below. That row gives this year's observed frequency for each moving violation category for the sample of 120 AutoWrecks customers. The second row of numbers gives the frequencies expected for a sample of 120 AutoWrecks customers if the moving violations distribution for this year is the same as the distribution for a "typical" year. The bottom row of numbers contains the following value for each of the moving violation categories. (Observed frequency - Expected frequency )* SE Expected frequency Part 1 Fill in the missing values in the table. Round your responses for the expected frequencies to two or more decimal places. Round your responses to three or more decimal places. fE Send data to Excel Exactly two Exactly Three or No one more Total violations violation violations violations Observed frequency 70 16 29 120 fo Expected frequency fE 12.00 6.00 1.333 0.167 fE Rart ?

MATLAB: An Introduction with Applications
6th Edition
ISBN:9781119256830
Author:Amos Gilat
Publisher:Amos Gilat
Chapter1: Starting With Matlab
Section: Chapter Questions
Problem 1P

Related questions
Question
Transcribed Image Text:AutoWrecks, Inc. sells auto insurance. AutoWrecks keeps close tabs on its customers' driving records,
updating its rates according to the trends indicated by these records. AutoWrecks' records indicate that, in a
"typical" year, roughly 70% of the company's customers do not commit a moving violation, 10% commit
exactly one moving violation, 15% commit exactly two moving violations, and 5% commit three or more
moving violations.
This past year's driving records for a random sample of 120 AutoWrecks customers are summarized by the
first row of numbers in the table below. That row gives this year's observed frequency for each moving
violation category for the sample of 120 AutoWrecks customers. The second row of numbers gives the
frequencies expected for a sample of 120 AutoWrecks customers if the moving violations distribution for this
year is the same as the distribution for a "typical" year. The bottom row of numbers contains the following
value for each of the moving violation categories.
Aa
(Observed frequency - Expected frequency )
fE
Expected frequency
Part 1
Fill in the missing values in the table. Round your responses for the expected frequencies to two or more
(fo-fe)
decimal places. Round your
responses to three or more decimal places.
fE
Send data to Excel
Exactly
Exactly
Three or
?
No
one
two
more
Total
violations
violation
violations
violations
Observed
frequency
70
16
29
5
120
fo
Expected
frequency
fE
12.00
6.00
1.333
0.167
fE
Part 2
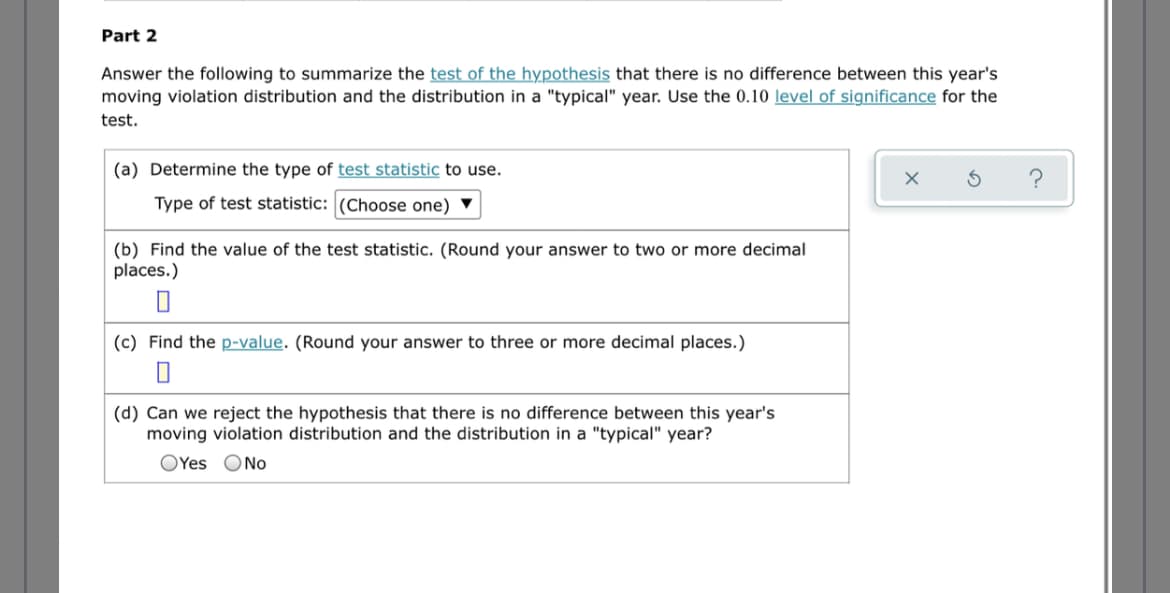
Transcribed Image Text:Part 2
Answer the following to summarize the test of the hypothesis that there is no difference between this year's
moving violation distribution and the distribution in a "typical" year. Use the 0.10 level of significance for the
test.
(a) Determine the type of test statistic to use.
Type of test statistic: (Choose one) ▼
(b) Find the value of the test statistic. (Round your answer to two or more decimal
places.)
(c) Find the p-value. (Round your answer to three or more decimal places.)
(d) Can we reject the hypothesis that there is no difference between this year's
moving violation distribution and the distribution in a "typical" year?
OYes ONo
Expert Solution
This question has been solved!
Explore an expertly crafted, step-by-step solution for a thorough understanding of key concepts.

This is a popular solution!

Trending now
This is a popular solution!

Step by step
Solved in 3 steps with 3 images

Recommended textbooks for you
MATLAB: An Introduction with Applications
Statistics
ISBN:
9781119256830
Author:
Amos Gilat
Publisher:
John Wiley & Sons Inc

Probability and Statistics for Engineering and th…
Statistics
ISBN:
9781305251809
Author:
Jay L. Devore
Publisher:
Cengage Learning

Statistics for The Behavioral Sciences (MindTap C…
Statistics
ISBN:
9781305504912
Author:
Frederick J Gravetter, Larry B. Wallnau
Publisher:
Cengage Learning
MATLAB: An Introduction with Applications
Statistics
ISBN:
9781119256830
Author:
Amos Gilat
Publisher:
John Wiley & Sons Inc
Probability and Statistics for Engineering and th…
Statistics
ISBN:
9781305251809
Author:
Jay L. Devore
Publisher:
Cengage Learning
Statistics for The Behavioral Sciences (MindTap C…
Statistics
ISBN:
9781305504912
Author:
Frederick J Gravetter, Larry B. Wallnau
Publisher:
Cengage Learning

Elementary Statistics: Picturing the World (7th E…
Statistics
ISBN:
9780134683416
Author:
Ron Larson, Betsy Farber
Publisher:
PEARSON

The Basic Practice of Statistics
Statistics
ISBN:
9781319042578
Author:
David S. Moore, William I. Notz, Michael A. Fligner
Publisher:
W. H. Freeman

Introduction to the Practice of Statistics
Statistics
ISBN:
9781319013387
Author:
David S. Moore, George P. McCabe, Bruce A. Craig
Publisher:
W. H. Freeman