AutoZone, Inc. Consolidated Balance Sheets August 31, 2019 August 25, 2018 (in thousands) Assets Current assets: Cash and cash equivalents $ 176,300 308,995 4,319,113 224,277 $ 217,824 258,136 3,943,670 216,239 4,635,869 Accounts receivable Merchandise inventories Other current assets Total current assets 5,028,685 Property and equipment: Land Buildings and improvements Equipment Leasehold improvements Construction in progress 1,147,709 3,895,559 1,991,042 552,018 126,868 1,107,092 3,698,010 1,841,330 504,656 140,535 7,713,196 3,314,445 7,291,623 3,073,223 Less: Accumulated depreciation and amortization 4,398,751 302,645 26,861 138,971 4,218,400 302,645 34,620 155,446 Goodwill Deferred income taxes Other long-term assets 468,477 492,711 $ 9,895,913 $ 9,346,980 Liabilities and Stockholders' Deficit Current liabilities: Accounts payable Accrued expenses and other Income taxes payable $ 4,864,912 621,932 25,297 $ 4,409,372 606,894 12,415 Total current liabilities Long-term debt Deferred income taxes Other long-term liabilities Commitments and contingencies 5,512,141 5,206,344 311,980 579,299 5,028,681 5,005,930 285,204 547,520 Stockholders' deficit: Preferred stock, authorized 1,000 shares; no shares issued Common stock, par value $.01 per share, authorized 200,000 shares; 25,445 shares issued and 24,038 shares outstanding in 2019 and 27,530 shares issued and 25,742 shares outstanding in 2018 Additional paid-in capital 254 275 1,264,448 (1,305,347) (269,322) (1,403,884) 1,155,426 (1,208,824) (235,805) (1,231,427) Retained deficit Accumulated other comprehensive loss Treasury stock, at cost (1,713,851) $ 9,895,913 Total stockholders' deficit (1,520,355) $ 9,346,980 AutoZone, Inc. Consolidated Statements of Cash Flows Year Ended August 31, 2019 August 25, 2018 August 26, 2017 (in thousands) (53 weeks) (52 weeks) (52 weeks) Cash flows from operating activities: Net income $ 1,617,221 $ 1,337,536 $ 1,280,869 Adjustments to reconcile net income to net cash provided by operating activities: Depreciation and amortization of property and equipment and intangibles Amortization of debt origination fees 369,957 8,162 35,051 43,255 345,084 8,393 (124,261) 43,674 (11,596) 130,263 193,162 323,051 8,369 74,902 38,244 (17,761) Deferred income taxes Share-based compensation expense Pension plan contributions Pension termination charges (refund) Asset impairment Changes in operating assets and liabilities: Accounts receivable (6,796) (48,512) (394,147) 464,176 7,534 (188,782) 319,609 (6,438) 26,114 7,795 (236,807) 82,614 (3,659) 12,995 Merchandise inventories Accounts payable and accrued expenses Income taxes payable (10,489) 50,635 Other, net Net cash provided by operating activities 2,128,513 2,080,292 1,570,612 Cash flows from investing activities: Capital expenditures Proceeds from sale of assets (496,050) (521,788) 35,279 (104,536) 69,644 (459) (553,832) Purchase of marketable debt securities (55,538) 53,140 6,602 (85,711) 82,993 2,951 Proceeds from sale of marketable debt securities Proceeds (payments) from disposal of capital assets and other, net Net cash used in investing activities (491,846) (521,860) (553,599) Cash flows from financing activities: Net (payments of) proceeds from commercial paper Proceeds from issuance of debt (295,300) 750,000 (250,000) 188,819 (2,004,896) (53,307) (9,404) 170,200 Repayment of debt Net proceeds from sale of common stock Purchase of treasury stock Payments of capital lease obligations Other, net (250,000) 89,715 (1,592,013) (49,004) (1,052) (42,400) 600,000 (400,000) 54,686 (1,071,649) (47,604) (7,362) Net cash used in financing activities (914,329) (1,674,088) (4,103) (41,524) 217,824 (1,632,154) (1,724) Effect of exchange rate changes on cash Net (decrease) increase in cash and cash equivalents Cash and cash equivalents at beginning of year Cash and cash equivalents at end of year 852 (75,446) 293,270 103,536 189,734 2$ 176,300 217,824 293,270 Supplemental cash flow information: Interest paid, net of interest cost capitalized 153,371 163,965 135,331 Income taxes paid 2$ 383,871 $ 427,161 $ 579,925 Assets acquired through capital lease $ 147,699 98,782 84,011
AutoZone, Inc. Consolidated Balance Sheets August 31, 2019 August 25, 2018 (in thousands) Assets Current assets: Cash and cash equivalents $ 176,300 308,995 4,319,113 224,277 $ 217,824 258,136 3,943,670 216,239 4,635,869 Accounts receivable Merchandise inventories Other current assets Total current assets 5,028,685 Property and equipment: Land Buildings and improvements Equipment Leasehold improvements Construction in progress 1,147,709 3,895,559 1,991,042 552,018 126,868 1,107,092 3,698,010 1,841,330 504,656 140,535 7,713,196 3,314,445 7,291,623 3,073,223 Less: Accumulated depreciation and amortization 4,398,751 302,645 26,861 138,971 4,218,400 302,645 34,620 155,446 Goodwill Deferred income taxes Other long-term assets 468,477 492,711 $ 9,895,913 $ 9,346,980 Liabilities and Stockholders' Deficit Current liabilities: Accounts payable Accrued expenses and other Income taxes payable $ 4,864,912 621,932 25,297 $ 4,409,372 606,894 12,415 Total current liabilities Long-term debt Deferred income taxes Other long-term liabilities Commitments and contingencies 5,512,141 5,206,344 311,980 579,299 5,028,681 5,005,930 285,204 547,520 Stockholders' deficit: Preferred stock, authorized 1,000 shares; no shares issued Common stock, par value $.01 per share, authorized 200,000 shares; 25,445 shares issued and 24,038 shares outstanding in 2019 and 27,530 shares issued and 25,742 shares outstanding in 2018 Additional paid-in capital 254 275 1,264,448 (1,305,347) (269,322) (1,403,884) 1,155,426 (1,208,824) (235,805) (1,231,427) Retained deficit Accumulated other comprehensive loss Treasury stock, at cost (1,713,851) $ 9,895,913 Total stockholders' deficit (1,520,355) $ 9,346,980 AutoZone, Inc. Consolidated Statements of Cash Flows Year Ended August 31, 2019 August 25, 2018 August 26, 2017 (in thousands) (53 weeks) (52 weeks) (52 weeks) Cash flows from operating activities: Net income $ 1,617,221 $ 1,337,536 $ 1,280,869 Adjustments to reconcile net income to net cash provided by operating activities: Depreciation and amortization of property and equipment and intangibles Amortization of debt origination fees 369,957 8,162 35,051 43,255 345,084 8,393 (124,261) 43,674 (11,596) 130,263 193,162 323,051 8,369 74,902 38,244 (17,761) Deferred income taxes Share-based compensation expense Pension plan contributions Pension termination charges (refund) Asset impairment Changes in operating assets and liabilities: Accounts receivable (6,796) (48,512) (394,147) 464,176 7,534 (188,782) 319,609 (6,438) 26,114 7,795 (236,807) 82,614 (3,659) 12,995 Merchandise inventories Accounts payable and accrued expenses Income taxes payable (10,489) 50,635 Other, net Net cash provided by operating activities 2,128,513 2,080,292 1,570,612 Cash flows from investing activities: Capital expenditures Proceeds from sale of assets (496,050) (521,788) 35,279 (104,536) 69,644 (459) (553,832) Purchase of marketable debt securities (55,538) 53,140 6,602 (85,711) 82,993 2,951 Proceeds from sale of marketable debt securities Proceeds (payments) from disposal of capital assets and other, net Net cash used in investing activities (491,846) (521,860) (553,599) Cash flows from financing activities: Net (payments of) proceeds from commercial paper Proceeds from issuance of debt (295,300) 750,000 (250,000) 188,819 (2,004,896) (53,307) (9,404) 170,200 Repayment of debt Net proceeds from sale of common stock Purchase of treasury stock Payments of capital lease obligations Other, net (250,000) 89,715 (1,592,013) (49,004) (1,052) (42,400) 600,000 (400,000) 54,686 (1,071,649) (47,604) (7,362) Net cash used in financing activities (914,329) (1,674,088) (4,103) (41,524) 217,824 (1,632,154) (1,724) Effect of exchange rate changes on cash Net (decrease) increase in cash and cash equivalents Cash and cash equivalents at beginning of year Cash and cash equivalents at end of year 852 (75,446) 293,270 103,536 189,734 2$ 176,300 217,824 293,270 Supplemental cash flow information: Interest paid, net of interest cost capitalized 153,371 163,965 135,331 Income taxes paid 2$ 383,871 $ 427,161 $ 579,925 Assets acquired through capital lease $ 147,699 98,782 84,011

Cornerstones of Financial Accounting
4th Edition
ISBN:9781337690881
Author:Jay Rich, Jeff Jones
Publisher:Jay Rich, Jeff Jones
Chapter7: Operating Assets
Section: Chapter Questions
Problem 24CE

Related questions
Question
what is the return in assets for each year?
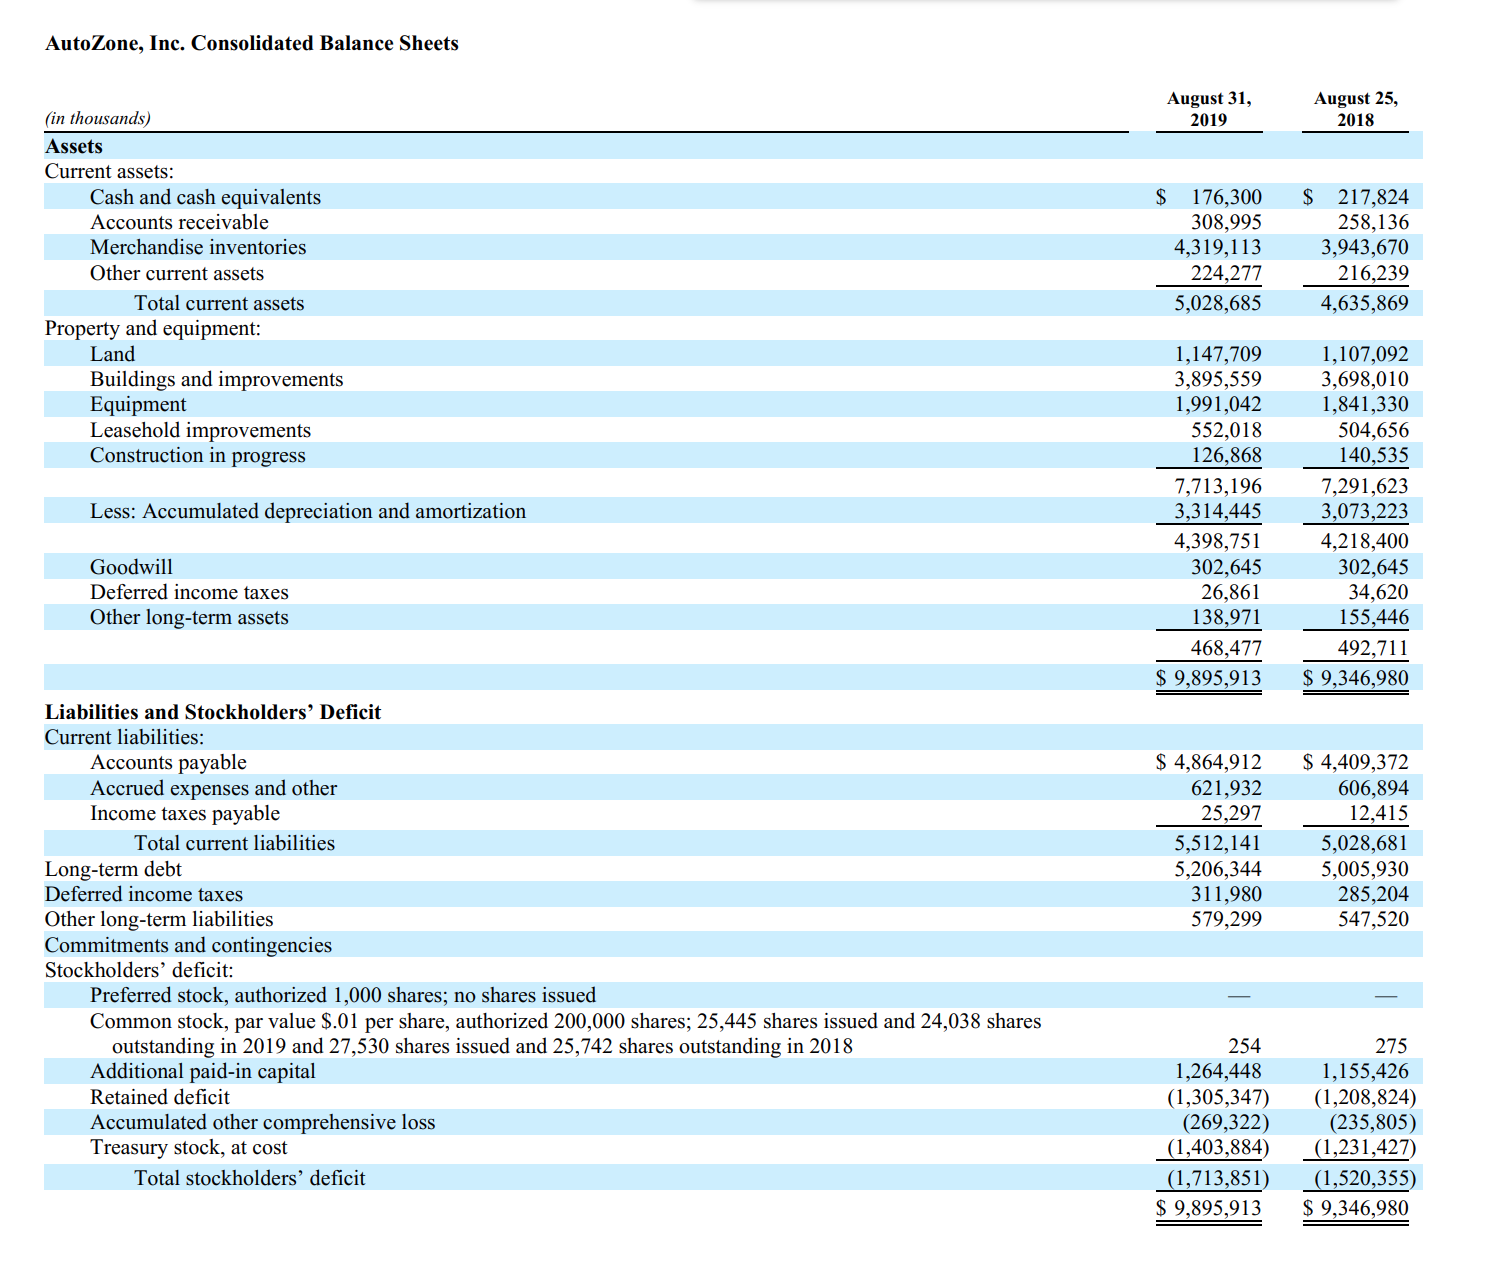
Transcribed Image Text:AutoZone, Inc. Consolidated Balance Sheets
August 31,
2019
August 25,
2018
(in thousands)
Assets
Current assets:
Cash and cash equivalents
$ 176,300
308,995
4,319,113
224,277
$ 217,824
258,136
3,943,670
216,239
4,635,869
Accounts receivable
Merchandise inventories
Other current assets
Total current assets
5,028,685
Property and equipment:
Land
Buildings and improvements
Equipment
Leasehold improvements
Construction in progress
1,147,709
3,895,559
1,991,042
552,018
126,868
1,107,092
3,698,010
1,841,330
504,656
140,535
7,713,196
3,314,445
7,291,623
3,073,223
Less: Accumulated depreciation and amortization
4,398,751
302,645
26,861
138,971
4,218,400
302,645
34,620
155,446
Goodwill
Deferred income taxes
Other long-term assets
468,477
492,711
$ 9,895,913
$ 9,346,980
Liabilities and Stockholders' Deficit
Current liabilities:
Accounts payable
Accrued expenses and other
Income taxes payable
$ 4,864,912
621,932
25,297
$ 4,409,372
606,894
12,415
Total current liabilities
Long-term debt
Deferred income taxes
Other long-term liabilities
Commitments and contingencies
5,512,141
5,206,344
311,980
579,299
5,028,681
5,005,930
285,204
547,520
Stockholders' deficit:
Preferred stock, authorized 1,000 shares; no shares issued
Common stock, par value $.01 per share, authorized 200,000 shares; 25,445 shares issued and 24,038 shares
outstanding in 2019 and 27,530 shares issued and 25,742 shares outstanding in 2018
Additional paid-in capital
254
275
1,264,448
(1,305,347)
(269,322)
(1,403,884)
1,155,426
(1,208,824)
(235,805)
(1,231,427)
Retained deficit
Accumulated other comprehensive loss
Treasury stock, at cost
(1,713,851)
$ 9,895,913
Total stockholders' deficit
(1,520,355)
$ 9,346,980
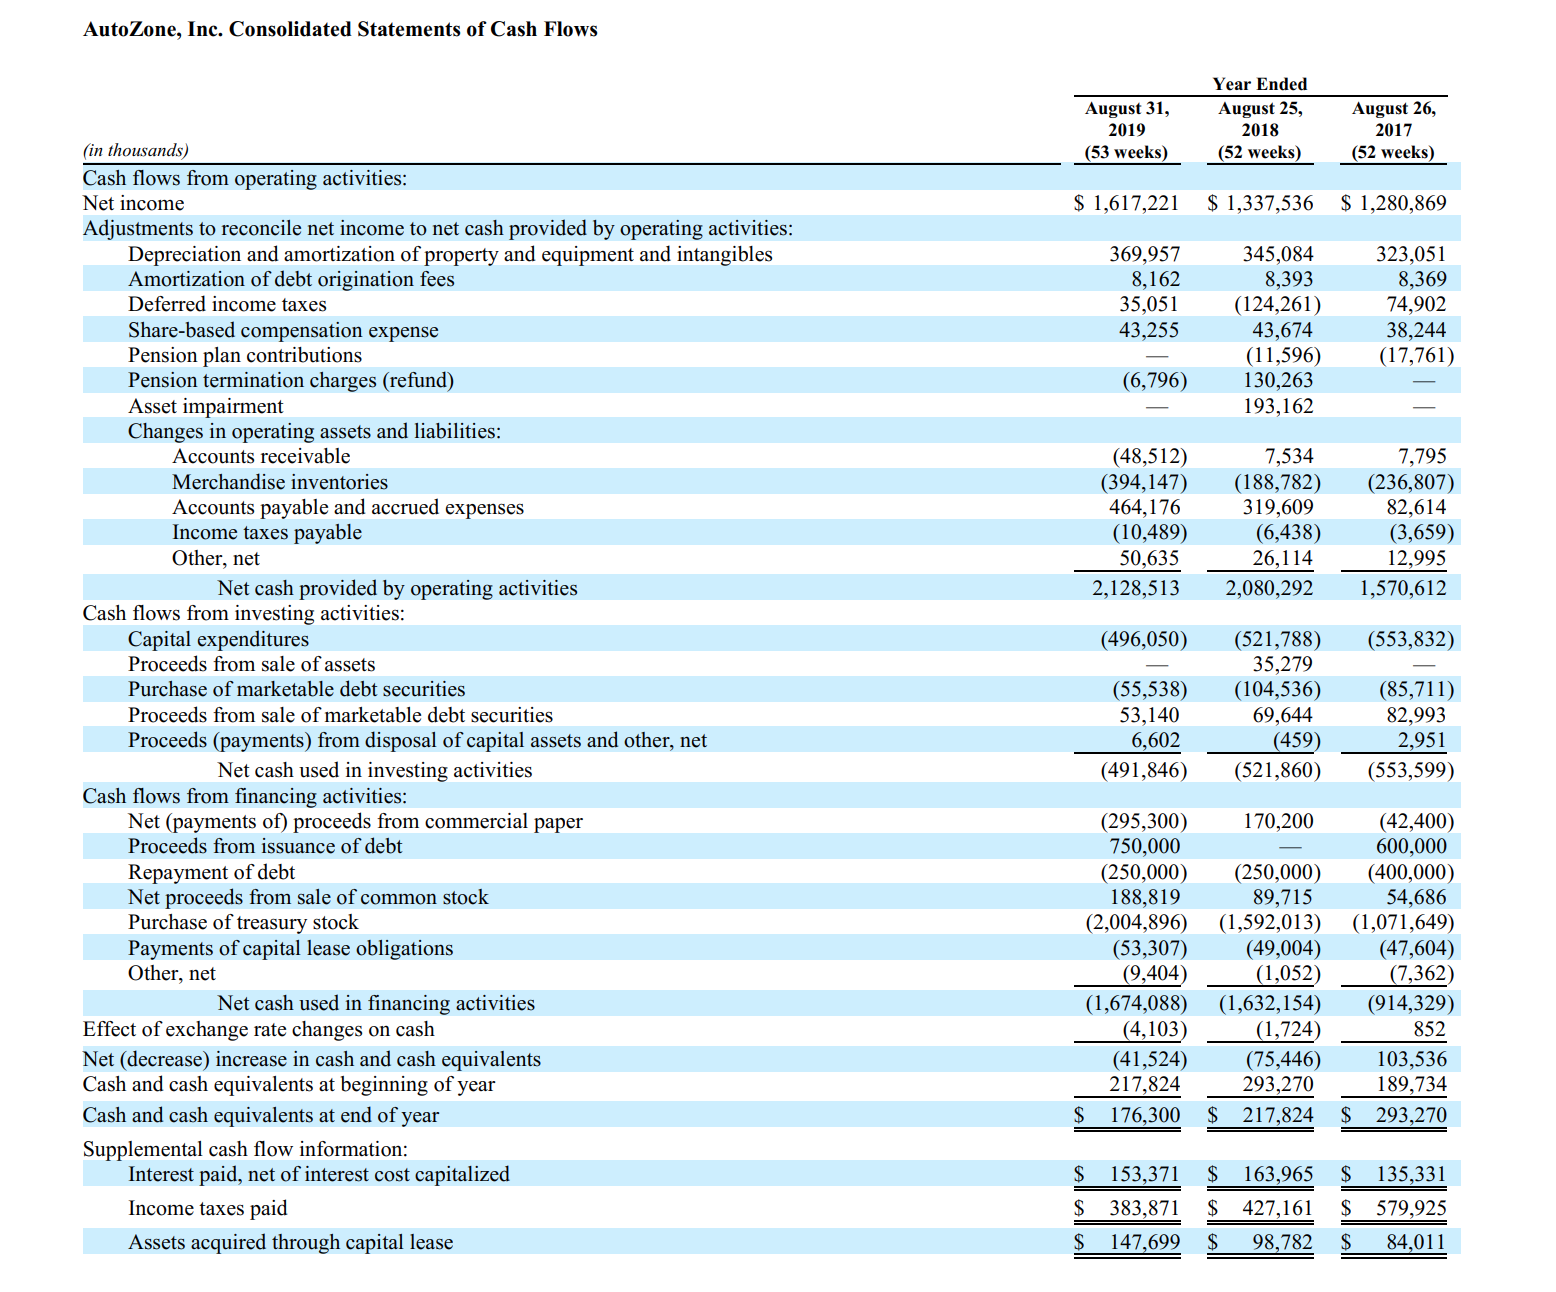
Transcribed Image Text:AutoZone, Inc. Consolidated Statements of Cash Flows
Year Ended
August 31,
2019
August 25,
2018
August 26,
2017
(in thousands)
(53 weeks)
(52 weeks)
(52 weeks)
Cash flows from operating activities:
Net income
$ 1,617,221
$ 1,337,536
$ 1,280,869
Adjustments to reconcile net income to net cash provided by operating activities:
Depreciation and amortization of property and equipment and intangibles
Amortization of debt origination fees
369,957
8,162
35,051
43,255
345,084
8,393
(124,261)
43,674
(11,596)
130,263
193,162
323,051
8,369
74,902
38,244
(17,761)
Deferred income taxes
Share-based compensation expense
Pension plan contributions
Pension termination charges (refund)
Asset impairment
Changes in operating assets and liabilities:
Accounts receivable
(6,796)
(48,512)
(394,147)
464,176
7,534
(188,782)
319,609
(6,438)
26,114
7,795
(236,807)
82,614
(3,659)
12,995
Merchandise inventories
Accounts payable and accrued expenses
Income taxes payable
(10,489)
50,635
Other, net
Net cash provided by operating activities
2,128,513
2,080,292
1,570,612
Cash flows from investing activities:
Capital expenditures
Proceeds from sale of assets
(496,050)
(521,788)
35,279
(104,536)
69,644
(459)
(553,832)
Purchase of marketable debt securities
(55,538)
53,140
6,602
(85,711)
82,993
2,951
Proceeds from sale of marketable debt securities
Proceeds (payments) from disposal of capital assets and other, net
Net cash used in investing activities
(491,846)
(521,860)
(553,599)
Cash flows from financing activities:
Net (payments of) proceeds from commercial paper
Proceeds from issuance of debt
(295,300)
750,000
(250,000)
188,819
(2,004,896)
(53,307)
(9,404)
170,200
Repayment of debt
Net proceeds from sale of common stock
Purchase of treasury stock
Payments of capital lease obligations
Other, net
(250,000)
89,715
(1,592,013)
(49,004)
(1,052)
(42,400)
600,000
(400,000)
54,686
(1,071,649)
(47,604)
(7,362)
Net cash used in financing activities
(914,329)
(1,674,088)
(4,103)
(41,524)
217,824
(1,632,154)
(1,724)
Effect of exchange rate changes on cash
Net (decrease) increase in cash and cash equivalents
Cash and cash equivalents at beginning of year
Cash and cash equivalents at end of year
852
(75,446)
293,270
103,536
189,734
2$
176,300
217,824
293,270
Supplemental cash flow information:
Interest paid, net of interest cost capitalized
153,371
163,965
135,331
Income taxes paid
2$
383,871
$ 427,161
$
579,925
Assets acquired through capital lease
$ 147,699
98,782
84,011
Expert Solution
This question has been solved!
Explore an expertly crafted, step-by-step solution for a thorough understanding of key concepts.

This is a popular solution!

Trending now
This is a popular solution!

Step by step
Solved in 2 steps with 2 images

Knowledge Booster


Learn more about
Need a deep-dive on the concept behind this application? Look no further. Learn more about this topic, accounting and related others by exploring similar questions and additional content below.Recommended textbooks for you
Cornerstones of Financial Accounting
Accounting
ISBN:
9781337690881
Author:
Jay Rich, Jeff Jones
Publisher:
Cengage Learning

Fundamentals Of Financial Management, Concise Edi…
Finance
ISBN:
9781337902571
Author:
Eugene F. Brigham, Joel F. Houston
Publisher:
Cengage Learning

Financial Accounting: The Impact on Decision Make…
Accounting
ISBN:
9781305654174
Author:
Gary A. Porter, Curtis L. Norton
Publisher:
Cengage Learning
Cornerstones of Financial Accounting
Accounting
ISBN:
9781337690881
Author:
Jay Rich, Jeff Jones
Publisher:
Cengage Learning
Fundamentals Of Financial Management, Concise Edi…
Finance
ISBN:
9781337902571
Author:
Eugene F. Brigham, Joel F. Houston
Publisher:
Cengage Learning
Financial Accounting: The Impact on Decision Make…
Accounting
ISBN:
9781305654174
Author:
Gary A. Porter, Curtis L. Norton
Publisher:
Cengage Learning

Intermediate Accounting: Reporting And Analysis
Accounting
ISBN:
9781337788281
Author:
James M. Wahlen, Jefferson P. Jones, Donald Pagach
Publisher:
Cengage Learning