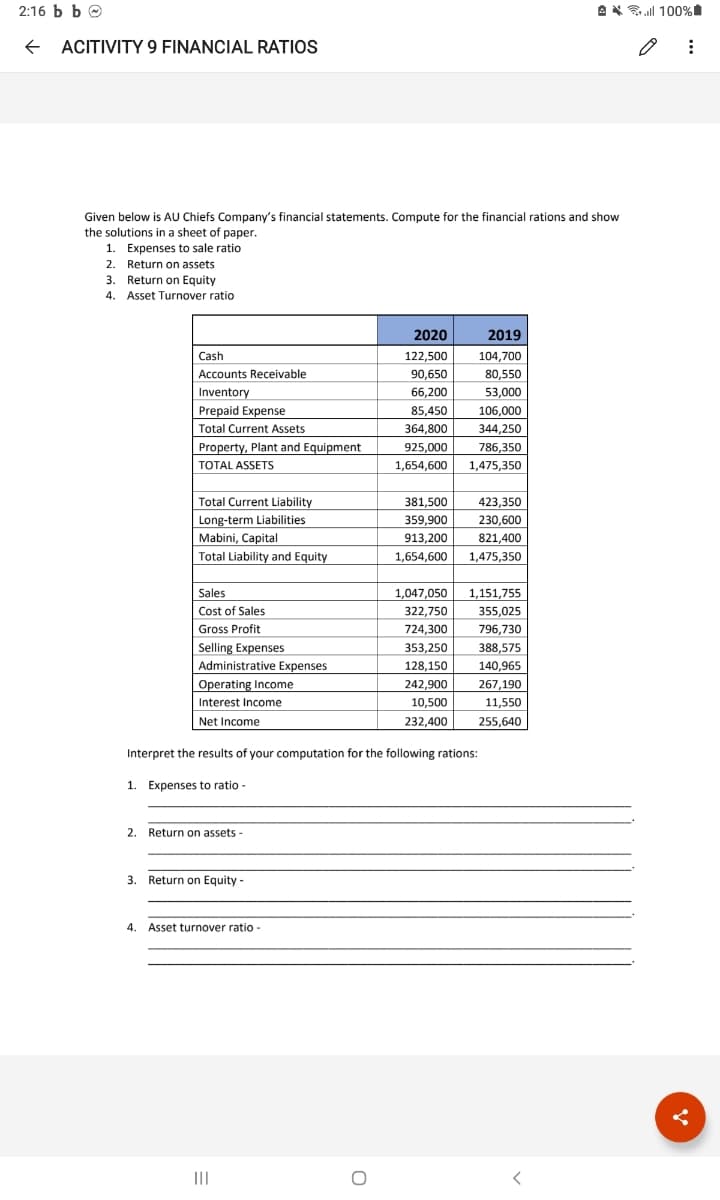
Given below is AU Chiefs Company's financial statements. Compute for the financial rations and show the solutions in a sheet of paper. 1. Expenses to sale ratio 2. Return on assets 3. Return on Equity 4. Asset Turnover ratio 2020 2019 Cash 122,500 104,700 Accounts Receivable 90,650 80,550 66,200 53,000 Inventory Prepaid Expense Total Current Assets 85,450 106,000 344,250 786,350 1,475,350 364,800 Property, Plant and Equipment 925,000 TOTAL ASSETS 1,654,600 Total Current Liability Long-term Liabilities Mabini, Capital Total Liability and Equity 381,500 359,900 913,200 1,654,600 423,350 230,600 821,400 1,475,350 Sales 1,047,050 1,151,755 Cost of Sales 322,750 355,025 Gross Profit 724,300 796,730 Selling Expenses Administrative Expenses Operating Income Interest Income Net Income 388,575 140,965 267,190 11,550 255,640 353,250 128,150 242,900 10,500 232,400 Interpret the results of your computation for the following rations: 1. Expenses to ratio - 2. Return on assets -
Q: Comparative balance sheets for 2021 and 2020, a statement of income for 2021 and additional…
A: Cash flow statement: It is a statement which reports the cash inflows and outflows of a business…
Q: The following information is provided for the Hildebrand Company: Balances at 30 June 2021 2020…
A: The cash flow from operating activities includes the cash flow from regular activities of the…
Q: Review the select information for Bean Superstore and Legumes Plus (industry competitors), and then…
A: Account Receivable turnover = Net credit salesAverage account receivables Number of days' Sales =…
Q: The following financial statements and additional information are reported. IKIBAN INCORPORATED…
A: In order to determine the Cash flow on total assets ratio, the cash flow from operations are…
Q: Using the information below I am looking for assistance to filling in the blanks in the attached…
A: Cash flow statement shows the cash inflows and outflows of a company. Cash Flow Statement is of two…
Q: Sandhill Company had the following information available at the end of 2020. SANDHILLCOMPANY…
A: A cash flow statement is a financial statement that shows the amount of cash and cash equivalents…
Q: The table below contains data on Fincorp Inc. The balance sheet items correspond to values at…
A: Solution: Introduction: EPS stands for Earning Per share, which is a measure of financial…
Q: Allstate Moving Company reported the following amounts on its balance sheet as of December 31, 2019…
A: Given that, 2019 Cash and receivables $75,000 Merchandise inventory $175,000 Total assets…
Q: The following data were taken from the comparative balance sheet of Osborn Sisters Company for the…
A: Working Capital = Current Assets - Current Liabilities Current Ratio = Current Assets/ Current…
Q: The table below contains data on Fincorp Inc. The balance sheet items correspond to values at…
A: Balance sheet using the market value of net fixed asset and long term debt is prepared to calculate…
Q: Use the folloiwng information to complete the financial statement as follows Profit margin rtio 20%…
A: Income statement is a statement that helps in determining the income or the profit and loss of a…
Q: Using the information below, what is Puppy Company's debt to total assets ratio f 2019? The…
A: The question is based on the concept of ratio analysis. Ratio analysis is a quantitative method to…
Q: solve in 15 minutes The comparative balance sheets for 2021 and 2020 and the statement of income…
A: Statement of cash flows is one of the cash flows statement which shows all cash inflows and cash…
Q: The table below contains data on Fincorp Inc. The balance sheet items correspond to values at…
A: Revenue is an income and statement item and is used to calculate profit and loss. We have the cost…
Q: The comparative balance sheets for 2021 and 2020 and the income statement for 2021 are given below…
A: Activities under the cash flow statement is classified as: Cash flows from operating activities…
Q: [The following information applies to the questions displayed below.] The following financial…
A: Statement of Cash Flow - Statement of Cash flow shows shows the movement of cash in the financial…
Q: Comparative balance sheet accounts of Sarasota Inc. are presented below. SARASOTA INC. COMPARATIVE…
A: A Cash flow statement is prepared to analyze the inflows and outflows of cash and cash equivalents…
Q: Following are the financial statements of AB Ltd. for 2019. Balance sheet (S in millions) Income…
A: As per our guidelines, we are allowed to answer first 3 sub-parts, Kindly ask the remaining parts as…
Q: Comparative balance sheet accounts of Sheridan Inc. are presented below. SHERIDAN INC.…
A: Statement of Cash Flow - Statement of Cash Flow is the statement that shows the actual movement of…
Q: Ayayai Inc., a greeting card company, had the following statements prepared as of December 31, 2020.…
A: The cash flow statement is prepared to record cash flow from various activities during the period…
Q: Bethesda Mining Company reports the following balance sheet information for 2018 and 2019.…
A: Calculation of current ratio, quick ratio, cash ratio, debt-equity ratio and total debt ratio: Excel…
Q: Whispering Inc., a greeting card company, had the following statements prepared as of December 31,…
A: The cash flow statement is an essential part of the financial statements of the organization. It is…
Q: I need help on (d) and (e) of this: I need help on this: The Arctic Company's income statement and…
A: A Cash flow statement is a financial statement that provides the summarised information regarding…
Q: The comparative balance sheet for the ZYX Company at December 31, 2019 and 2018 is as follows:…
A: The cash flow statement is an essential part of the financial statements of the organization. It is…
Q: operating activities section of the statement of cash flows using the indirect method
A: The statement of cash flows is a part of financial statement which shows the flow of cash across…
Q: The following information is taken from Randy Technology's statements of financial position at…
A: Accounting ratios are the ratios calculated to understand the performance, liquidity, and other…
Q: Mary, Inc. has prepared the following comparative balance sheets for 2020 and 2021: 2021…
A: The cash flow statement assesses a corporation's ability to handle its cash balance, or how…
Q: 2. Based on the following financial statement information, calculate and interpret the operating…
A: Formulas: Operating cycle=Days sales outstanding+Days inventory outstandingCash cycle=Operating…
Q: (1) 21,780 shares of common stock were sold at par on July 1, 2021. Net income for 2021 was $65,340.…
A: Return on common stockholders' equity = Net Income - Preferred DividendAverage common stockholders'…
Q: REQUIRED: Prepare a statement of cash flows in the pro forma provided on the following page. You…
A: Requirement: DON PTY LTD CASH FLOW STATEMENT FOR THE YEAR ENDED 30 JUNE 2020 $ $…
Q: Using the information below, what is Puppy Company's acid-test ratio (quick ratio) for 2019? The…
A: Acid Test ratio An acid ratio test, also known as a quick ratio or liquid ratio, measures the…
Q: Using the tabular analysis of business transactions, prepare, in good form, the income statement and…
A: Income statement is one of the financial statement which is prepared for review of profitability of…
Q: Jung Corporation has the following account balances at April 30, 2020. Using this information,…
A:
Q: The following information was extracted from the financial statement of Barry for the year ended 31…
A: Here in this case, we are require to calculate purchases, gross profit and net profit. We already…
Q: is the current ratio for 2020 and 2019
A:
Q: Review the select information for Bean Superstore and Legumes Plus (industry competitors), and then…
A: Income statement and balance sheet are the financial statements that are prepared at the end of the…
Q: The following financial statements and additional information are reported. IKIBAN INc. Comparative…
A: Cash flows on total assets=Operating cash flowAverage total assets
Q: I need help on this: The Arctic Company's income statement and comparative balance sheets at…
A:
Q: Luxe Mobile Homes reported the following in its financial statements for the year ended December 31,…
A: The cash flow statement is prepared to record the cash flow from various activities during the…
Q: Empire Moving Company reported the following amounts on its Balance Sheet as of December 31, 2018…
A: Ratio, horizontal and vertical analysis are the tools used by the financial analyst to measure the…
Q: The following information has been extracted from the financial statements of Greenstar Limited.…
A: If Account receivable is based on sales, then we need to first calculate the rate of account…
Q: Comparative balance sheet accounts of Martinez Inc. are presented below. MARTINEZ INC. COMPARATIVE…
A: Cash flow statement: It is a statement which reports the cash inflows and outflows of a business…
Q: The company reported a current ratio of 2.1 and 2.22 as of December 31, 2020 and December 31, 2021…
A: Answer:- Liabilities definition:- A liability is anything that a person or corporation owes,…
Q: Martinez Company had the following information available at the end of 2020. MARTINEZCOMPANY…
A: Cash flow statement: It is a summary of the statement that shows increase and decrease in the…
Q: The condensed financial statements of Evoc Company for the years 2019 and 2020 are presented as…
A: Since we only answer up to 3 sub-parts, we’ll answer the first 3. Please resubmit the question and…
Q: The comparative balance sheets for 2021 and 2020 and the statement of income for 2021 are given…
A: Statement of cash flows is a statement which shows all cash inflows and cash outflows of business…
Q: Prepare a balance sheet using the following information for the Ginger Company as of March 31, 2019.…
A: Balance sheet: It is a statement which reports both assets and liabilities as on a particular date…
Q: Comparative balance sheet accounts of Waterway Inc. are presented below. WATERWAY INC. COMPARATIVE…
A: Cash Flow Statement is a Statement which provides the information about the cash inflow as well as…
Q: The table below contains data on Fincorp Inc. The balance sheet items correspond to values at…
A: Cash flow statement is a statement showing the flow of cash in an organization from 3 main…
Trending now
This is a popular solution!
Step by step
Solved in 2 steps
- Nineteen measures of solvency and profitability The comparative financial statements of Stargel Inc. are as follows. The market price of Stargel Inc. common stock was 119.70 on December 31, 2016. Stargel Inc. Comparative Retained Earnings Statement For the Years Ended December 31, 2016 and 2015 2016 2015 Retained earnings, January 1................ 5,375,000 4,545,000 Add net income for year......................... 900,000 925,000 Total..................................... 6,275,000 5,470,000 Deduct dividends: On preferred stock............................................. 45,000 45,000 On common stock.............................................. 50,000 50,000 Total........................................................ 95,0000 95,000 Retained earnings, December 3................................... 6,180,000 5,375,000 Stargel Inc. Comparative Income Statement For the Year Ended December 31, 2016 and 2015 2016 2015 Sales..................... 10,000,000 9,400,000 Cost of goods sold......... 5,350,000 4,950,000 Gross profit............... 4,650,000 4,450,000 Selling expenses.......... 2,000,000 1,080,000 Administrative expenses... 1,500.000 1,410,000 Total operating expenses 3,500,000 3,290,000 Income from operations ... 1,150,000 1,160,000 Other income............. 150,000 140,000 1,300,000 1,300,000 Other expense (interest). 170,000 150,000 Income before income tax 1,130,000 1,150,000 Income tax expense....... 230,000 225,000 Net income............... 900,000 925,000 Stargel Inc. Comparative Income Statement For the Year Ended December 31, 2016 and 2015 Dec.31, 2016 Dec. 31, 2015 Assets Current Assets: Cash.................................... 500,000 400,000 Marketable securities.................... 1,010,000 1,000,000 Accounts receivable (net)................. 740,000 510,000 Inventories.............................. 1,190000 950,000 Prepaid expenses........................ 250,000 229,000 Total current assets..................... 3,690,000 3,089,000 Long-term investments.................... 2,350,000 2,300,000 Property, plant and equipment (net)....... 3,740,000 3,366,000 Total assets............................... 9,780,000 8,755,000 Liabilities Current liabilities.......................... 900,000 880,000 Long-term liabilities: Mortgage note payable, 8.8%, due 2021... 200,000 0 Bonds payable, 9%, due 2017............. 1,500,000 1,500,000 Total long term liabilities............... 1,700,000 1,500,000 Total liabilities............................ 2,600,000 2,380,000 Stockholders' equity Preferred stock 0.90, 10 par.. 500,000 500,000 Common stock. 5 par..................... 500,000 500,000 Retained earnings......................... 6,180,000 5,375,000 Total stockholders' equity............... 7,180,000 6,375,000 Total liabilities and stockholders' equity..... 9,780,000 8,755,000 Instructions Determine the following measures for 2016, rounding to one decimal place, except per share amounts, which should be rounded to the nearest penny: 1. Working capital 2. Current ratio 3. Quick ratio 4. Accounts receivable turnover 5. Number of days salts in receivables 6. Inventory turnover 7. Number of days sales in inventory 8. Ratio of fixed assets to long-term liabilities 9. Ratio of liabilities to .stockholders' equity 10. Number of times interest charges are earned 11. Number of times preferred dividends are earned 12. Ratio of sales to assets 13. Rate earned on total assets 14. Rate earned on stockholders' equity 15. Rate earned on common stockholders' equity 16. Earnings per share on common stock 17. Price-earnings ratio 18. Dividends per share of common stock 19. Dividend yieldNineteen measures of solvency and profitability The comparative financial statements of Bettancort Inc. are as follows. The market price of Bettancort Inc. common stock was 71.25 on December 31, 2016. Bettancort Inc. Comparative Retained Earnings Statement For the Years Ended December 31, 2016 and 2015 2016 2015 Retained earnings. January 1......................................... 2,655,000 2,400,000 Add net income for year............................................. 300,000 280,000 Total............................................................... 2,955,000 2,680,000 Deduct dividends: On preferred stock................................................ 15,000 15,000 On common stock................................................. 10,000 10,000 Total........................................................... 25,000 25,000 Retained earnings. December 31..................................... 2,930,000 2,655,000 Bettancort Inc. Comparative Retained Earnings Statement For the Years Ended December 31, 2016 and 2015 2016 2015 Sales...................... 1,200,000 1,000,000 Cost of goods sold............ 500,000 475,000 Gross profit............... 700,000 525,000 Selling expenses.......... 240,000 200,000 Administrative expenses...... 180,000 150,000 Total operating expenses.. 420,000 350,000 Income from operations.. 280,000 175,000 Other income............. 166,000 225,000 446,000 400,000 Other expense (Interest)... 66,000 60,000 Income before income tax 380,000 340,000 Income tax expense....... 80,000 60,000 Net income............... 300,000 280,000 Bettancort Inc. Comparative Retained Earnings Statement For the Years Ended December 31, 2016 and 2015 Dec.31, 2016 Dec. 31, 2015 Assets Current Assets: Cash.................................... 450,000 400,000 Marketable securities.................... 300,000 260,000 Accounts receivable (net)................. 130,000 110,000 Inventories.............................. 67,000 58,000 Prepaid expenses........................ 153,000 139,000 Total current assets..................... 1,100,000 967,000 Long-term investments.................... 2,350,000 2,200,000 Property, plant and equipment (net)....... 1,320,000 1,118,000 Total assets............................... 4,770,000 4,355,000 Liabilities Current liabilities.......................... 440,000 400,000 Long-term liabilities: Mortgage note payable, 8.8%, due 2021... 100,000 0 Bonds payable, 9%, due 2017............. 1,000,000 1,000,000 Total long term liabilities............... 1,100,000 1,000,000 Total liabilities............................ 1,540,000 1,400,000 Stockholders' equity Preferred stock 0.90, 10 par.. 200,000 200,000 Common stock. 5 par..................... 100,000 100,000 Retained earnings......................... 2,930,000 2,665,000 Total stockholders equity............... 3,230,000 2,955,000 Total liabilities and stockholders' equity..... 4,770,000 4,355,000 Instructions Determine the following measures for 2016, rounding to one decimal place: 1. Working capital 2. Current ratio 3. Quick ratio 4. Accounts receivable turnover 5. Number of days' sales in receivables 6. Inventory turnover 7. Number of days' sales in inventory 8. Ratio of fixed assets to long-term liabilities 9. Ratio of liabilities to stockholders equity 10. Number of times interest charges are earned 11. Number of times preferred dividends are earned 12. Ratio of sales to assets 13. Rate earned on total assets 14. Rate earned on stockholders' equity 15. Rate earned on common stockholders' equity 16. Earnings per share on common stock 17. Price-earnings ratio 18. Dividends per share of common stock 19. Dividend yieldMeasures of liquidity, solvency and profitability The comparative financial statements of Stargel Inc. are as follows. The market price of common stock was 119.70 on December 31, 20Y2. Stargel Inc. Comparative Retained Earnings Statement For the Years Ended December 31, 20Y2 and 20Y1 20Y2 20Y1 Retained earnings, January 1............. 5,375,000 4,545,000 Net income............................. 900,000 925.000 Total................................ 6,275,000 5,470,000 Dividends: Preferred stock dividends............. 45,000 45,000 Common stock dividends............. 50,000 50,000 Total dividends.................... 95,000 95,000 Retained earnings, December 31......... 6,180,000 5,375,000 Stargel Inc. Comparative Income Statement For the Years Ended December 31, 20Y2 and 20Y1 20Y2 20Y1 Sales..................... 10,000,000 9,400,000 Cost of goods sold......... 5,350,000 4,950,000 Gross profit............... 4,650,000 4,450,000 Selling expenses.......... 2,000,000 1,880,000 Administrative expenses....... 1,500,000 1,410,000 Total operating expenses 3,500,000 3,290,000 Income from operations. 1,150.000 1,160,000 Other revenue............ 150,000 140,000 1,300,000 1,300,000 Other expense (interest).. 170,000 150,000 Income before income tax.. 1,130,000 1,150,000 Income tax expense....... 230,000 225,000 Net income............... 900,000 925,000 Stargel Inc. Comparative Balance Sheet December 31,20Y2 and 20Y1 20Y2 20Y1 Assets Current assets: Cash.......................................................... 500,000 400,000 Marketable securities........................................... 1,010,000 1,000,000 Accounts receivable (net)....................................... 740,000 510,000 Inventories.................................................... 1,190,000 950,000 Prepaid expenses.............................................. 250,000 229,000 Total current assets.......................................... 3,690,000 3,089,000 Long term investments............................................ 2,350,000 2,300,000 Property, plant, and equipment (net)............................... 3,740,000 3,366,000 Total assets....................................................... 9,780.000 8,755,000 Liabilities Current liabilities.................................................. 900,000 880,000 Long term liabilities: Mortgage note payable, 10%.................................... 200,000 0 Bonds payable, 10%............................................ 1,500,000 1,500,000 Total long term liabilities.................................... 1,700,000 1,500,000 Total liabilities.................................................... 2,600,000 2,380,000 Stockholders' Equity Preferred 0, 90 stock. 10 par...................................... 500,000 500,000 Common stock, 5 par............................................. 500,000 500,000 Retained earnings................................................. 6,180,000 5,375,000 Total stockholders' equity.......................................... 7,180,000 6,375,000 Total liabilities and stockholders' equity............................. 9,780,000 8,755,000 Instructions Determine the following measures for 20Y2, rounding to one decimal place including percentages, except for per-share amounts: 1. Working capital 2. Current ratio 3. Quick ratio 4. Accounts receivable turnover 5. Number of days sales in receivables 6. Inventory turnover 7. Number of days sales in inventory 8. Ratio of fixed assets to long-term liabilities 9. Ratio of liabilities to stockholders equity 10. Times interest earned 11. Asset turnover 12. Return on total assets 13. Return on stockholders equity- 14. Return on common stockholders equity 15. Earnings per share on common stock 16. Price-earnings ratio 17. Dividends per share of common stock 18. Dividend yield
- Profitability ratios The following selected data were taken from the financial statements of Robinson Inc. for December 31, 2016, 2015 and 2014: December31 2016 2015 2014 Total assets......................................... 4,800,000 4,400,000 4,000,000 Notes payable (8% interest)........................... 2,250,000 2,250,000 2,250,000 Common stock...................................... 250,000 250,000 250,000 Preferred 4% stock, 100 par (no change during year)........................... 500,000 500,000 500,000 Retained earnings................................... 1,574,000 1,222,000 750,000 The 2016 net income was 372,000, and the 2015 net income was 492,000. No dividends on common stock were declared between 2014 and 2016. a. Determine the rate earned on total assets, the rate earned on stockholders equity, and the rate earned on common Stockholders equity for the years 2015 and 2016. Round to one decimal place. b. What conclusions can be drawn from these data as to the companys profitability?Changes in current operating assets and liabilities-indirect method Alpenrose Corporations comparative balance sheet for current assets and liabilities was as follows: Dec. 31, 2016 Dec. 31, 2015 Accounts receivable 27,000 32,400 Inventory 18,000 15,480 Accounts payable 16,200 14,220 Dividends payable 49,500 53,100 Adjust net income of 207,000 for changes in operating assets and liabilities to arrive at net cash flow from operating activities.