Average net accounts receivable Average inventory Net cash provided by operating activities Capital expenditures Cash dividends paid (1) (2) (3) (4) (5) (6) (7) (8) (9) (10) (11) (12) (b) Ratio Current ratio Accounts receivable turnover Average collection period Inventory turnover Days in inventory Profit margin Asset turnover Return on assets Return on common stockholders' equity Debt to assets ratio Times interest earned Free cash flow Other Data $7,525 6,942 5,881 1,729 496 Target 1.63 8.6 42.0 6.6 55.3 3.8 1.5 5.6 17.1 66 6.5 $3,656 :1 times days times BIUT, T'I EE J JE days % times 2 % times Compare the liquidity, solvency, and profitability of the two companies. $4,025 33,836 26,249 12,184 4,217 Wal-Mart 0.87 :1 101.4 times 3.6 days 9.0 times 40.6 days 3.5 % 2.4 times 8.6 % 21.0 % 58 11.4 $9,848 times 11 用 T Wor
Average net accounts receivable Average inventory Net cash provided by operating activities Capital expenditures Cash dividends paid (1) (2) (3) (4) (5) (6) (7) (8) (9) (10) (11) (12) (b) Ratio Current ratio Accounts receivable turnover Average collection period Inventory turnover Days in inventory Profit margin Asset turnover Return on assets Return on common stockholders' equity Debt to assets ratio Times interest earned Free cash flow Other Data $7,525 6,942 5,881 1,729 496 Target 1.63 8.6 42.0 6.6 55.3 3.8 1.5 5.6 17.1 66 6.5 $3,656 :1 times days times BIUT, T'I EE J JE days % times 2 % times Compare the liquidity, solvency, and profitability of the two companies. $4,025 33,836 26,249 12,184 4,217 Wal-Mart 0.87 :1 101.4 times 3.6 days 9.0 times 40.6 days 3.5 % 2.4 times 8.6 % 21.0 % 58 11.4 $9,848 times 11 用 T Wor

Cornerstones of Financial Accounting
4th Edition
ISBN:9781337690881
Author:Jay Rich, Jeff Jones
Publisher:Jay Rich, Jeff Jones
Chapter9: Long-term Liabilities
Section: Chapter Questions
Problem 89E: Ratio Analysis Rising Stars Academy provided the following information on its 2019 balance sheet and...

Related questions
Question
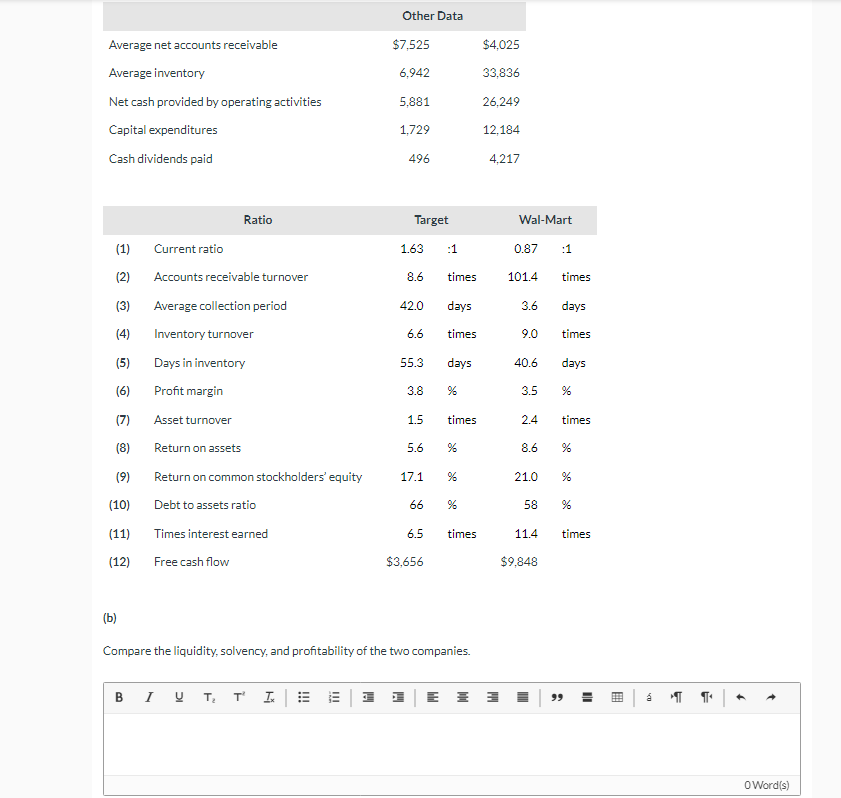
Transcribed Image Text:Average net accounts receivable
Average inventory
Net cash provided by operating activities
Capital expenditures
Cash dividends paid
(1)
(2)
(3) Average collection period
(4)
Inventory turnover
(5)
Days in inventory
(6)
Profit margin
(7)
Asset turnover
(8)
Return on assets
Return on common stockholders' equity
Debt to assets ratio
Times interest earned
Free cash flow
(9)
(10)
(11)
(12)
Ratio
(b)
Current ratio
Accounts receivable turnover
BIUT, T I E
Other Data
!!!!
$7,525
6,942
5,881
1,729
496
Target
1.63
8.6
42.0
6.6
55.3
3.8
1.5
5.6
17.1
66
6.5
$3,656
:1
times
days
times
days
%
times
%
%
%
Compare the liquidity, solvency, and profitability of the two companies.
times
플
$4,025
33,836
26,249
12,184
4,217
Wal-Mart
0.87 :1
times
days
9.0 times
101.4
3.6
40.6
3.5
2.4
21.0
8.6 %
58
days
%
11.4
$9,848
times
%
%
times
9
用
á
या पान |
O Word(s)
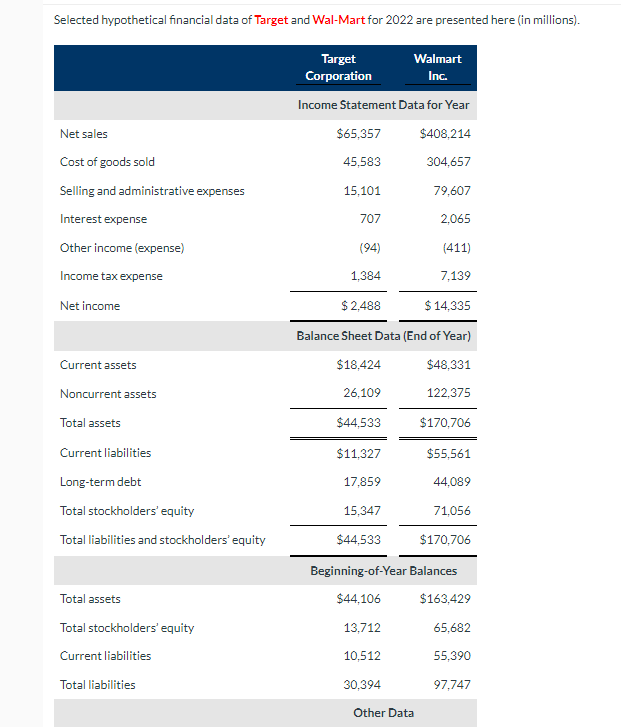
Transcribed Image Text:Selected hypothetical financial data of Target and Wal-Mart for 2022 are presented here (in millions).
Target
Corporation
Net sales
Cost of goods sold
Selling and administrative expenses
Interest expense
Other income (expense)
Income tax expense
Net income
Current assets
Noncurrent assets
Total assets
Current liabilities
Long-term debt
Total stockholders' equity
Total liabilities and stockholders' equity
Total assets
Total stockholders' equity
Current liabilities
Total liabilities
Walmart
Inc.
Income Statement Data for Year
$65,357
$408,214
45,583
304,657
79,607
707
2,065
(94)
(411)
1,384
7,139
$ 2,488
$ 14,335
Balance Sheet Data (End of Year)
$18,424
$48,331
122,375
$170,706
$55,561
44,089
71,056
$170,706
15,101
26,109
$44,533
$11,327
17,859
15,347
$44,533
Beginning-of-Year Balances
$44,106
$163,429
65,682
55,390
97,747
13,712
10,512
30,394
Other Data
Expert Solution
This question has been solved!
Explore an expertly crafted, step-by-step solution for a thorough understanding of key concepts.

Step by step
Solved in 4 steps

Knowledge Booster


Learn more about
Need a deep-dive on the concept behind this application? Look no further. Learn more about this topic, accounting and related others by exploring similar questions and additional content below.Recommended textbooks for you
Cornerstones of Financial Accounting
Accounting
ISBN:
9781337690881
Author:
Jay Rich, Jeff Jones
Publisher:
Cengage Learning

Fundamentals Of Financial Management, Concise Edi…
Finance
ISBN:
9781337902571
Author:
Eugene F. Brigham, Joel F. Houston
Publisher:
Cengage Learning

Intermediate Financial Management (MindTap Course…
Finance
ISBN:
9781337395083
Author:
Eugene F. Brigham, Phillip R. Daves
Publisher:
Cengage Learning
Cornerstones of Financial Accounting
Accounting
ISBN:
9781337690881
Author:
Jay Rich, Jeff Jones
Publisher:
Cengage Learning
Fundamentals Of Financial Management, Concise Edi…
Finance
ISBN:
9781337902571
Author:
Eugene F. Brigham, Joel F. Houston
Publisher:
Cengage Learning
Intermediate Financial Management (MindTap Course…
Finance
ISBN:
9781337395083
Author:
Eugene F. Brigham, Phillip R. Daves
Publisher:
Cengage Learning