Avery Collins Kinsley McDonnough Ross Shannon January February March April May June $ 3,671 $ 2,973 $ 4,017 $ 5,040 $ 4,963 $5,497 $ 3,798 $ 1,549 $ 992 $2,267 $ 3,201 $ 4,008 2,996 $ 6,948 $4,205 $ 5,523 $ 6,597 $5,147 $3,496 $ 1,975 $ 2,936 $ 3,498 $ $ 2,003 $ 4,190 $ 4,038 $ 2,064 $ 7,015 $ 6,832 $ 5,971 $ 5,497 $ 1,172 $ 866 $2,109 $ 3,385 $ 4,078 $ 3,598 Trends Bonus
Avery Collins Kinsley McDonnough Ross Shannon January February March April May June $ 3,671 $ 2,973 $ 4,017 $ 5,040 $ 4,963 $5,497 $ 3,798 $ 1,549 $ 992 $2,267 $ 3,201 $ 4,008 2,996 $ 6,948 $4,205 $ 5,523 $ 6,597 $5,147 $3,496 $ 1,975 $ 2,936 $ 3,498 $ $ 2,003 $ 4,190 $ 4,038 $ 2,064 $ 7,015 $ 6,832 $ 5,971 $ 5,497 $ 1,172 $ 866 $2,109 $ 3,385 $ 4,078 $ 3,598 Trends Bonus

Fundamentals of Financial Management (MindTap Course List)
15th Edition
ISBN:9781337395250
Author:Eugene F. Brigham, Joel F. Houston
Publisher:Eugene F. Brigham, Joel F. Houston
Chapter4: Analysis Of Financial Statements
Section: Chapter Questions
Problem 24P: Income Statement for Year Ended December 31, 2018 (Millions of Dollars) Net sales 795.0 Cost of...

Related questions

Topic Video
Question
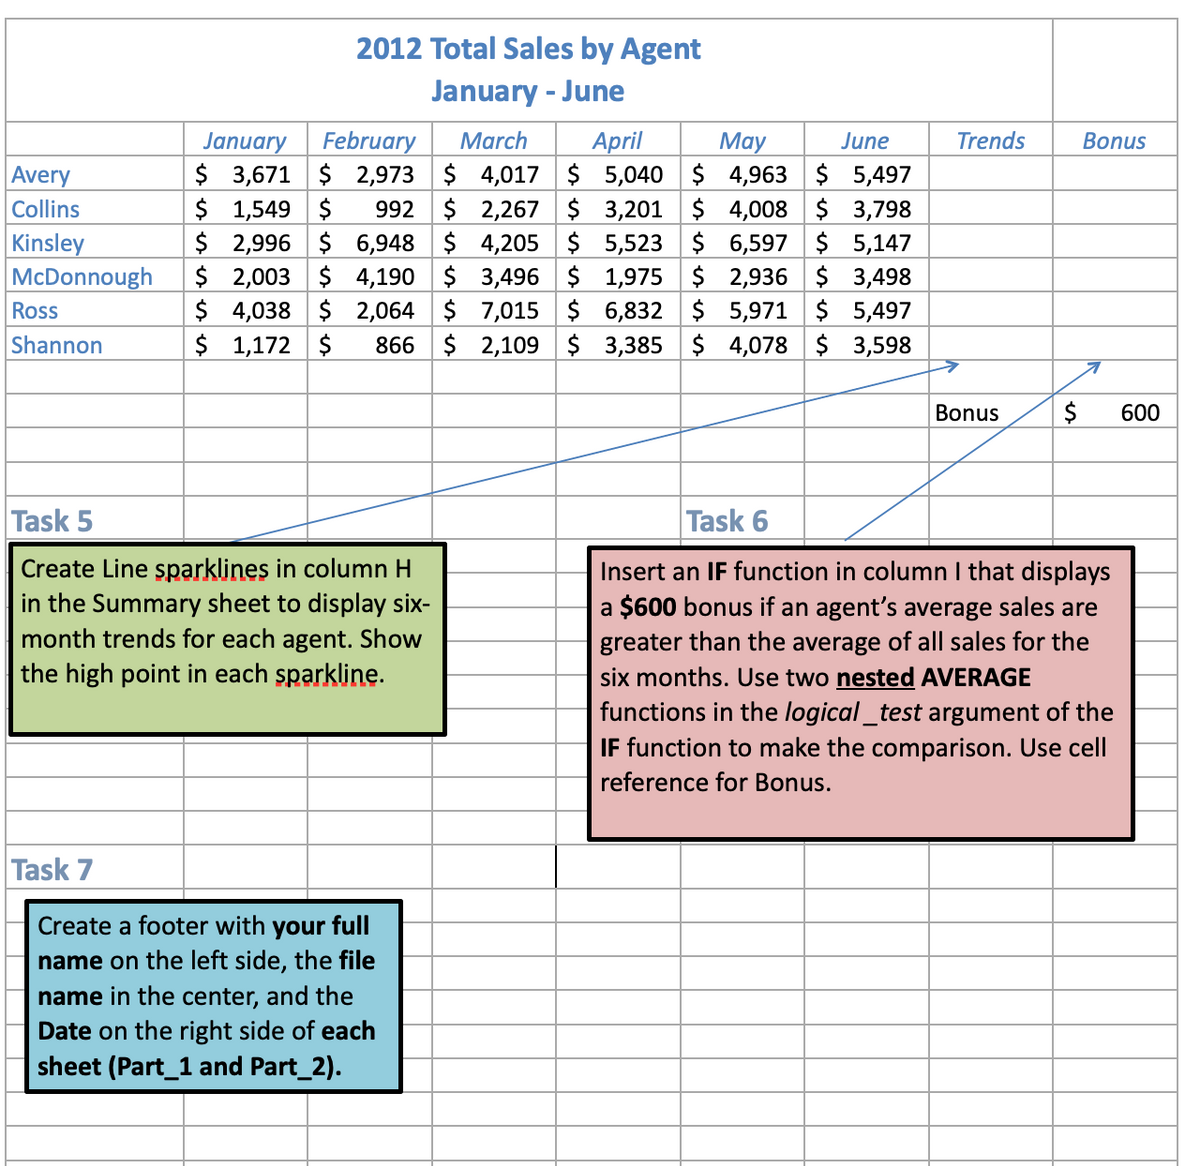
Transcribed Image Text:Avery
Collins
Kinsley
McDonnough
Ross
Shannon
2012 Total Sales by Agent
January - June
January
February
March
April
$ 3,671 $ 2,973 $ 4,017 $ 5,040 $
$ 1,549 $
992
$
$2,267 $ 3,201 $
2,996 $ 6,948 $ 4,205 $ 5,523 $
2,003 $ 4,190 $ 3,496 $
$ 4,038 $ 2,064 $ 7,015 $
$ 1,172 $ 866 $2,109 $
$
Task 5
Create Line sparklines in column H
in the Summary sheet to display six-
month trends for each agent. Show
the high point in each sparkline.
Task 7
Create a footer with your full
name on the left side, the file
name in the center, and the
Date on the right side of each
sheet (Part_1 and Part_2).
May
June
4,963 $ 5,497
4,008 $ 3,798
6,597 $ 5,147
1,975 $ 2,936 $ 3,498
6,832 $ 5,971 $ 5,497
3,385 $ 4,078 $ 3,598
Trends
Bonus
$
Bonus
Task 6
Insert an IF function in column I that displays
a $600 bonus if an agent's average sales are
greater than the average of all sales for the
six months. Use two nested AVERAGE
functions in the logical_test argument of the
IF function to make the comparison. Use cell
reference for Bonus.
600
Expert Solution
This question has been solved!
Explore an expertly crafted, step-by-step solution for a thorough understanding of key concepts.

This is a popular solution!

Trending now
This is a popular solution!

Step by step
Solved in 3 steps with 2 images

Knowledge Booster


Learn more about
Need a deep-dive on the concept behind this application? Look no further. Learn more about this topic, finance and related others by exploring similar questions and additional content below.Recommended textbooks for you
Fundamentals of Financial Management (MindTap Cou…
Finance
ISBN:
9781337395250
Author:
Eugene F. Brigham, Joel F. Houston
Publisher:
Cengage Learning
Fundamentals of Financial Management (MindTap Cou…
Finance
ISBN:
9781337395250
Author:
Eugene F. Brigham, Joel F. Houston
Publisher:
Cengage Learning