b-2. Find the p-value. p-value < 0.01 0.01 s p-value < 0.025 0.025 sp-value < 0.05 0.05 s p-value < 0.10 p-value ≥ 0.10 b-3. At the 5% significance level, What is the conclusion? Reject He since the p-value is greater than significance level. 2
b-2. Find the p-value. p-value < 0.01 0.01 s p-value < 0.025 0.025 sp-value < 0.05 0.05 s p-value < 0.10 p-value ≥ 0.10 b-3. At the 5% significance level, What is the conclusion? Reject He since the p-value is greater than significance level. 2
Holt Mcdougal Larson Pre-algebra: Student Edition 2012
1st Edition
ISBN:9780547587776
Author:HOLT MCDOUGAL
Publisher:HOLT MCDOUGAL
Chapter11: Data Analysis And Probability
Section: Chapter Questions
Problem 8CR
Related questions
Question
100%
Answer completely. No need for long solutions. Just brief solutions with correct answers. I will upvote. Thank you

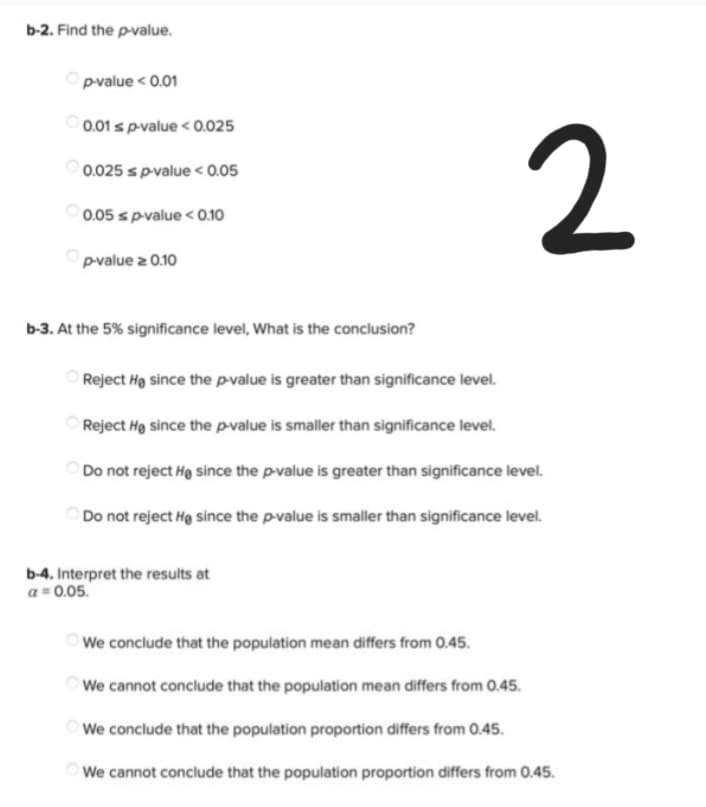
Transcribed Image Text:b-2. Find the p-value.
p-value < 0.01
0.01 s p-value < 0.025
0.025 s p-value < 0.05
0.05 s p-value < 0.10
p-value z 0.10
b-3. At the 5% significance level, What is the conclusion?
2
Reject He since the p-value is greater than significance level.
Reject He since the p-value is smaller than significance level.
Do not reject He since the p-value is greater than significance level.
Do not reject He since the p-value is smaller than significance level.
We conclude that the population mean differs from 0.45.
We cannot conclude that the population mean differs from 0.45.
We conclude that the population proportion differs from 0.45.
We cannot conclude that the population proportion differs from 0.45.
b-4. Interpret the results at
a = 0.05.

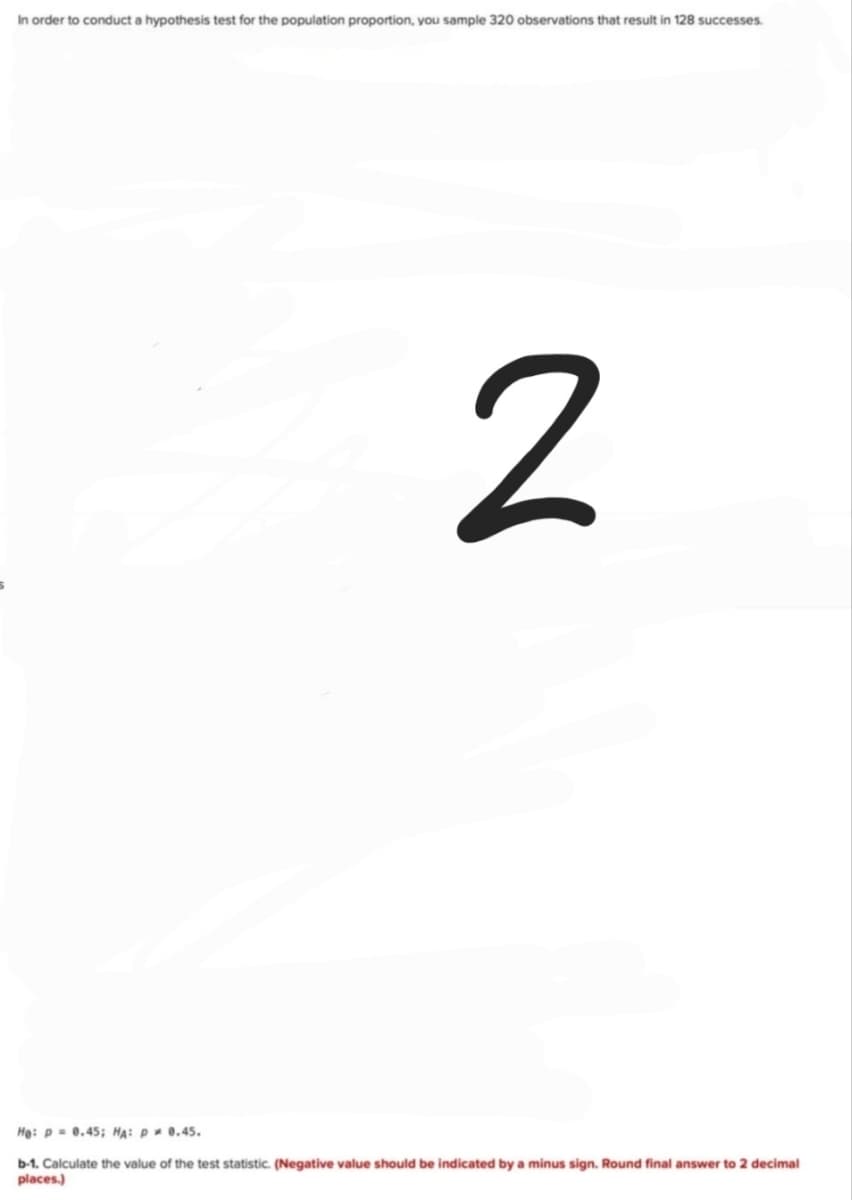
Transcribed Image Text:In order to conduct a hypothesis test for the population proportion, you sample 320 observations that result in 128 successes.
2
He: p= 0.45; HA: P = 0.45.
b-1. Calculate the value of the test statistic. (Negative value should be indicated by a minus sign. Round final answer to 2 decimal
places.)
Expert Solution
This question has been solved!
Explore an expertly crafted, step-by-step solution for a thorough understanding of key concepts.
This is a popular solution!
Trending now
This is a popular solution!
Step by step
Solved in 5 steps

Recommended textbooks for you

Holt Mcdougal Larson Pre-algebra: Student Edition…
Algebra
ISBN:
9780547587776
Author:
HOLT MCDOUGAL
Publisher:
HOLT MCDOUGAL

Big Ideas Math A Bridge To Success Algebra 1: Stu…
Algebra
ISBN:
9781680331141
Author:
HOUGHTON MIFFLIN HARCOURT
Publisher:
Houghton Mifflin Harcourt

College Algebra (MindTap Course List)
Algebra
ISBN:
9781305652231
Author:
R. David Gustafson, Jeff Hughes
Publisher:
Cengage Learning

Holt Mcdougal Larson Pre-algebra: Student Edition…
Algebra
ISBN:
9780547587776
Author:
HOLT MCDOUGAL
Publisher:
HOLT MCDOUGAL

Big Ideas Math A Bridge To Success Algebra 1: Stu…
Algebra
ISBN:
9781680331141
Author:
HOUGHTON MIFFLIN HARCOURT
Publisher:
Houghton Mifflin Harcourt

College Algebra (MindTap Course List)
Algebra
ISBN:
9781305652231
Author:
R. David Gustafson, Jeff Hughes
Publisher:
Cengage Learning