B-25 Determine the sample size for each of the control procedures shown in the following table (assuming a very large population): Control Procedure
B-25 Determine the sample size for each of the control procedures shown in the following table (assuming a very large population): Control Procedure

MATLAB: An Introduction with Applications
6th Edition
ISBN:9781119256830
Author:Amos Gilat
Publisher:Amos Gilat
Chapter1: Starting With Matlab
Section: Chapter Questions
Problem 1P

Related questions
Question
100%
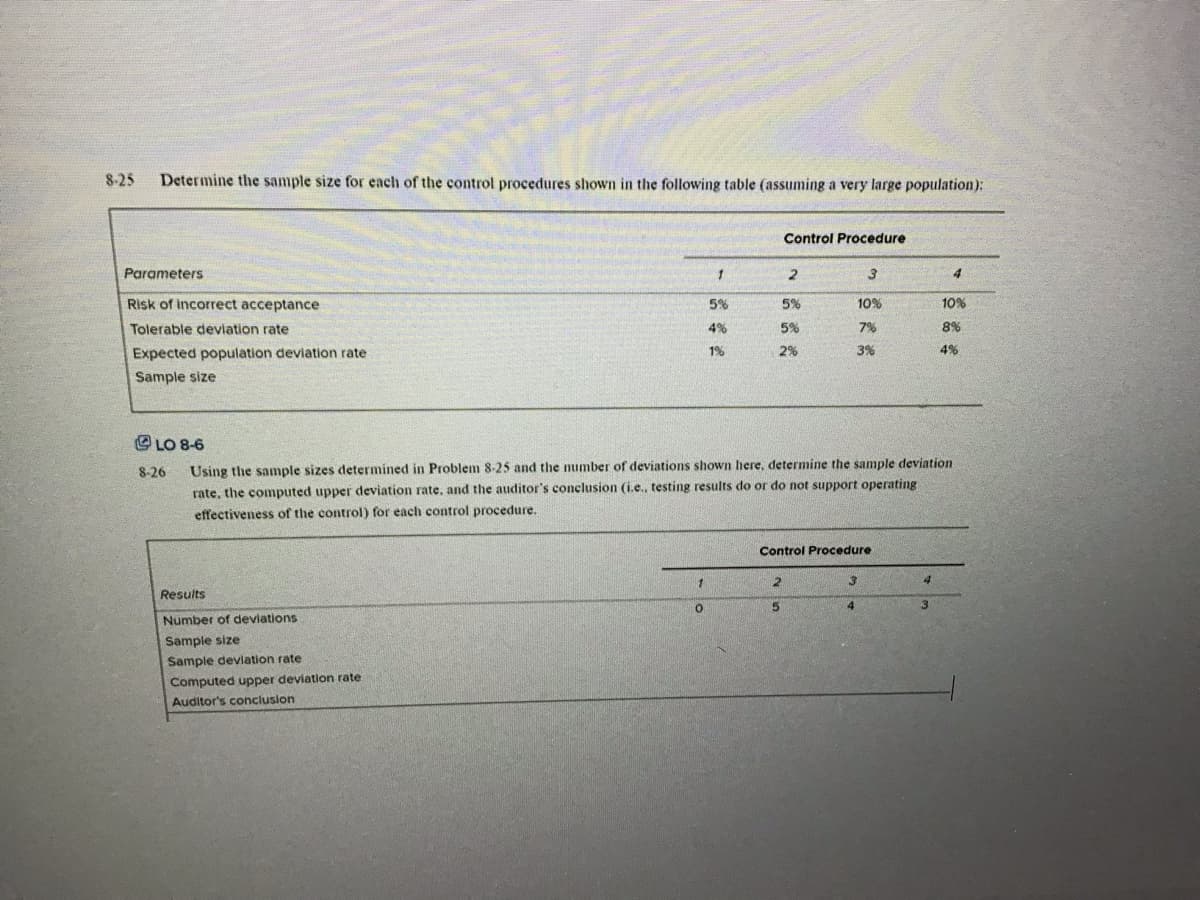
Transcribed Image Text:8-25
Determine the sample size for each of the control procedures shown in the following table (assuming a very large population):
Parameters
Risk of incorrect acceptance
Tolerable deviation rate
Expected population deviation rate
Sample size
8-26
Results
Number of deviations
Sample size
Sample deviation rate
Computed upper deviation rate
Auditor's conclusion
1
1
0
5%
4%
1%
LO 8-6
Using the sample sizes determined in Problem 8-25 and the number of deviations shown here, determine the sample deviation
rate, the computed upper deviation rate, and the auditor's conclusion (i.e., testing results do or do not support operating
effectiveness of the control) for each control procedure.
Control Procedure
5%
5%
2%
2
2
5
3
10%
7%
Control Procedure
3%
4
3
4
3
4
10%
8%
4%
Expert Solution
This question has been solved!
Explore an expertly crafted, step-by-step solution for a thorough understanding of key concepts.

This is a popular solution!

Trending now
This is a popular solution!

Step by step
Solved in 4 steps with 4 images

Recommended textbooks for you
MATLAB: An Introduction with Applications
Statistics
ISBN:
9781119256830
Author:
Amos Gilat
Publisher:
John Wiley & Sons Inc

Probability and Statistics for Engineering and th…
Statistics
ISBN:
9781305251809
Author:
Jay L. Devore
Publisher:
Cengage Learning

Statistics for The Behavioral Sciences (MindTap C…
Statistics
ISBN:
9781305504912
Author:
Frederick J Gravetter, Larry B. Wallnau
Publisher:
Cengage Learning
MATLAB: An Introduction with Applications
Statistics
ISBN:
9781119256830
Author:
Amos Gilat
Publisher:
John Wiley & Sons Inc
Probability and Statistics for Engineering and th…
Statistics
ISBN:
9781305251809
Author:
Jay L. Devore
Publisher:
Cengage Learning
Statistics for The Behavioral Sciences (MindTap C…
Statistics
ISBN:
9781305504912
Author:
Frederick J Gravetter, Larry B. Wallnau
Publisher:
Cengage Learning

Elementary Statistics: Picturing the World (7th E…
Statistics
ISBN:
9780134683416
Author:
Ron Larson, Betsy Farber
Publisher:
PEARSON

The Basic Practice of Statistics
Statistics
ISBN:
9781319042578
Author:
David S. Moore, William I. Notz, Michael A. Fligner
Publisher:
W. H. Freeman

Introduction to the Practice of Statistics
Statistics
ISBN:
9781319013387
Author:
David S. Moore, George P. McCabe, Bruce A. Craig
Publisher:
W. H. Freeman