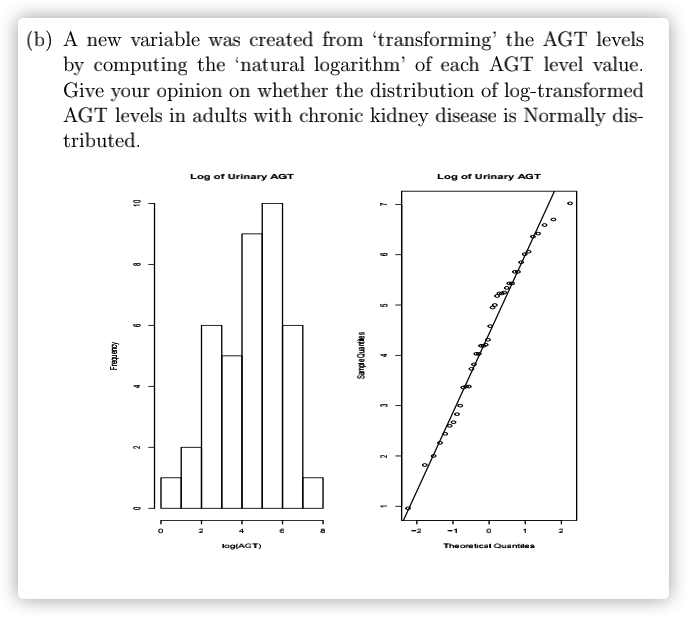
b) A new variable was created from 'transforming' the AGT levels by computing the 'natural logarithm' of each AGT level value. Give your opinion on whether the distribution of log-transformed AGT levels in adults with chronic kidney disease is Normally dis- tributed. Log of Urinary AGT Log of Urinary AOT kogAGT) TheorebeaI Quantte laertey SamdeQuartles


Q: 3. The data in Table 3.1 are from an investigation of an outbreak of severe abdominal pain,…
A: Given the data as ID Age BLL Log10BLL 1 3 69 1.84 2 4 45 1.66 3 6 49 1.69 4 7 84 1.92 5…
Q: We have data on the lean body mass and resting metabolic rate for 12 women who are subjects in a…
A: We can solve this using least square method
Q: It has been noted that the amount of time people spend shopping in supermarkets has decreased due to…
A:
Q: The number of pounds of steam used per month by a chemical plant is thought to be related to the…
A: Note: Hi there! Thank you for posting the question. As the question in the subpart (3) is…
Q: (1) Do life expectancy and income appear to be associated or independent? (2) Has the relationship…
A: The scatter plot of variable income and life expectancy is given.
Q: Wendy's restaurant has been recognized for having the fastest average service time among fast food…
A: Given that u=2.2 The Probalility density function(PDF) of exponential distribution is The…
Q: A consulting group was hired by the Human Resources Department at General Mills, Inc. to survey…
A: Solution: The given multiple regression equation is as follows: Where y^ is the estimated index of…
Q: 1. A researcher is studying the effect of parents' level of education on educational achievement of…
A: Since you have posted a question with multiple sub-parts, we will solve first three sub-parts for…
Q: 3. According to a Los Angeles Times study of more than 1 million medical dispatches from 2007 to…
A: The mean is the average value of the data and mode is the value that has highest frequency in the…
Q: The median starting salary for new law school graduates is determined by log(salary) = Bo + B,LSAT +…
A: (1)We expect β5<0 as β5 represent sensitivity of the salary to law school ranking. As rank of law…
Q: In 1998 El Salvador had a gini index of 54.50 and 26 years later had a gini index of 38.
A:
Q: A GLM was used to estimate the expected losses per customer across gender and driver type. There are…
A: Male and commute are the base levels for Gender and Driver type
Q: A famous Chinese restaurant would like to find out the change in demand on its dim-sum. After…
A:
Q: (wolio! Jlgw) For the following data set {14.2, 126.9, 52.0, 8.5, 31.3, 14.6, 38.4, 71.0}, if…
A: For the following data set (14.2, 126.9, 52.0, 8.5, 31.3, 14.6, 38.4, 71.0}, if log8= 0.9031, We…
Q: The number of pounds of steam used per month by a chemical plant is thought to be related to the…
A: “Since you have posted a question with multiple sub-parts, we will solve first three sub-parts for…
Q: Mercury is a persistent and dispersive environmental contaminant found in many ecosystems around the…
A: (a) The sample mean is computed as follows: x=∑xin =18.5915 =1.2393 The sample mean is 1.2393.
Q: How sensitive to changes in water temperature are coral reefs? To find out, scientists examined data…
A: (b). Consider that X and Y are defined as Sea surface temperature and Growth, respectively.
Q: 2)- Industrial engineers periodically conduct "work measurement' analysis to determine the time…
A: The total working hours of worker in 50 days is,128, 119, 95, 97, 124, 128, 142, 98, 108, 120, 113,…
Q: We have data on the lean body mass and resting metabolic rate for 12 women who are subjects in a…
A: Calculate Fitting a straight line - Curve fitting using Least square method X Y 49.4 1070 45…
Q: In 2007, a university study was published investigating the crash risk of alcohol impaired driving.…
A: The data set is: BAC Risk 0 1 0.01 1.03 0.03 1.06 0.05 1.38 0.07 2.09 0.09 3.54…
Q: CONSTRUCT MODIFIED BOXPLOT To understand better the effects of exercise and aging on various…
A: Quartile measure the data set into four equal parts with three points. It has three quartile…
Q: Suppose that the time to failure (in hours) of fans in a personal computer can be modeled by an…
A:
Q: 3 The number of days ahead travelers purchase their airline tíckets can be modeled by the average…
A: Exponential Distribution: Let 'x' be a continuous random variable is said to follow Exponential…
Q: months are displayed. Data downloaded on 2/19/2020 from https://data.world/cityofaustin/cfer-vyii.…
A:
Q: The number of pounds of steam used per month by a chemical plant is thought to be related to the…
A: Note: Hi there! Thank you for posting the question. As there are multiple sub parts, according to…
Q: The number of pounds of steam used per month by a chemical plant is thought to be related to the…
A: Introduction: We have solved the problem using Excel. First, we have entered the data as shown…
Q: The following table gives the number of deaths due to accidental falls for each month during 1970.…
A: Solution: Let us first test whether “Accidents are uniformly distributed”, using a Chi-square test…
Q: The materials handling manager of a manufacturing company is trying to forecast the cost of…
A: Given data is Age Yearly Maintenance 5.5 1319 5.5 1749 5.5 1733 5.0 1195 5.0 1423…
Q: We have data on the lean body mass and resting metabolic rate for 12 women who are subjects in a…
A:
Q: An investigator wants to test if there is a difference in endotoxin levels in children who are…
A: SolutionAn investigator interested to study whether there is a difference in endotoxin levels in…
Q: Annual salaries in a large organization can be modeled as a lognormal variable with log (to the base…
A: Lognormal distribution:Lognormal distribution is a continuous probability distribution, in which the…
Q: A researcher is studying the effect of parents' level of education on educational achievement of…
A: Here observing table and values we need to find two answers. i) how we can campare degrees of…
Q: The materials handling manager of a manufacturing company is trying to forecast the cost of…
A: It is given that x be the age in years and y is yearly maintenance in dollars.
Q: Imagine you conducted a study to look at the association between whether expectant mothers in two…
A: The given information is age groups , eat breakfast (or not) and the Gender of the first born…
Q: Suppose that the time to failure (in hours) of fans in a personal computer can be modeled by an…
A: Given : Suppose that the time to failure (in hours) of fans in a personal computer can be modeled by…
Q: The number of pounds of steam used per month by a chemical plant is thought to be related to the…
A:
Q: According to Fidelity Investmest, the average weekly allowance A of children varies directly as…
A:
Q: Estimate the population regression model: In(TestScore) - Bo+Biln(STR) + B2lncome, + Balunch, + u,…
A: The correct answer is "Option d".
Q: In this UN data set, female life expectancy in years (lifeexpf) is regressed onto birthrate…
A: Since you have posted a question with multiple sub-parts, we will solve the first three sub-parts…
Q: necpts developed in Precalculus to HIUdel aIi uctuul make a prediction. In this case we will model…
A:
Q: The number of pounds of steam used per month by a chemical plant is thought to be related to the…
A: The independent variable is Temperature. The dependent variable is Usage/1000. We have to do…
Q: Show that the inverse exponential distribution has a heavier tail than the exponential distribution.
A: Probability distribution of exponential distribution: f(x)=λe-λx Exponential distribution CDF:…
Q: If a predictor variable X is found to be highly significant, we would conclude that O changes in X…
A:
Q: A study is run to estimate the incidence of atrial fibrillation (AF) in men and women over the age…
A: Developed AF Did not Develop AF Men 133 6153 Women 79 7167 To…
Q: The number of pounds of steam used per month by a chemical plant is thought to be related to the…
A: Since you have posted a question with multiple sub-parts, we will solve first three subparts for…
Q: Ten patients with advanced diabetic nephropathy (kidney complications of diabetes) were treated with…
A:
Q: 9.1 A General Social Survey asked: "Do you support or oppose the following measures to deal with…
A: (a) Given the Fit loglinear modes (GH,GI), (GH,HI), (GI,GI) and (GH,GI,HI) we will show that models…
Q: Daily production Frequency 80-90 90-100 9. 100-110 20 110-120 8 120-130 130-140 2
A: We have given data I want to find mean median and mode
Q: We have data on the lean body mass and resting metabolic rate for 12 women who are subjects in a…
A: Calculate Fitting a straight line - Curve fitting using Least square method X Y 40.5 1380…
Q: The following data represent the number of major hurricane strikes in a particular country each…
A: Given: Cubic function of best fit is: y=0.159x3-2.320x2+9.330x-4.2142 Using graphing Utility we…

Step by step
Solved in 2 steps

- Water availability is of prime importance in the life cycle of most reptiles. To determine the rate of evaporative water loss of a certain species of lizard at a particular desert site, 34 such lizards were randomly collected, weighed and placed under the appropriate experimental conditions. After 24 hours, each lizard was removed, weighed, and its total water loss was calculated by subtracting its body weight after treatment from its initial body weight. Previous studies have shown that the relative frequency distribution of water loss for this species of lizard has a mean of 3.1 grams and a s.d. of 0.8 gram b) What is the probability that x is less than 2.7 grams?Water availability is of prime importance in the life cycle of most reptiles. To determine the rate of evaporative water loss of a certain species of lizard at a particular desert site, 34 such lizards were randomly collected, weighed and placed under the appropriate experimental conditions. After 24 hours, each lizard was removed, weighed, and its total water loss was calculated by subtracting its body weight after treatment from its initial body weight. Previous studies have shown that the relative frequency distribution of water loss for this species of lizard has a mean of 3.1 grams and a s.d. of 0.8 gram. a) What is the approximate sampling distribution of x , the mean water loss of the 34 lizardsOne variety of corn is genetically modified to produce chemicals for defense against predators. The standard corn contains the same standard genotype, but without genetic modification for the chemicals. The two types of corn are then planted in randomly placed adjacent plots across a single field. The amount of predators that are present when the corn has matured are then recorded. The data that was recorded of the predators present among each type are listed. Has genetic alterations decreased the amount of predators for the altered genotype? Normality tests for the populations of both contain a p value less than 0.05. The given alpha is 0.05 Modified Corn (20, 18, 26, 23, 17, 23, 22) Standard Corn (89, 64, 102, 96, 56, 77, 84, 59) use an F test to determine if the variance between the 2 lists are different. Based on this result, state the correct 2 sample parametric test to be used. State the null and alternative. Show calculations while rounding to two decimal points.What is the…
- The table below is from a study called “The Epidemiology of Social Stress.” The researchers in this study conduct a series of statistical tests to shed light on the association between social status variables (IVs) and depression (DVs). The left-hand column shows the tests for mean depressive symptom scores (Number of symptoms reported [range:0-50], higher levels indicate higher number of reported depressive symptoms) by sex, age, marital status, and occupational prestige. The right-hand column shows the tests for prevalence of major depressive disorder (has major depression=1; does not have major depression=0), broken down by sex, age, marital status, and occupational prestige. Examine the table and answer questions a)At alpha=.05, what can you conclude about the association between marital status and mean depressive symptom scores? Briefly summarize the findings, and provide a plausible, logical explanation (theory) for the observed association (or lack thereof). b)At alpha =.001,…Tire pressure (psi) and mileage (mpg) were recorded for a random sample of seven cars of thesame make and model. The extended data table (left) and fit model report (right) are based on aquadratic model What is the predicted average mileage at tire pressure x = 31?Battery life is an important issue for many smartphone owners. Public health studies have examined "low-battery anxiety" and acute anxiety called nomophobia that results when a smartphone user's phone battery charge runs low and then dies.† Battery life between charges for the Samsung Galaxy S9 averages 31 hours when the primary use is talk time and 10 hours when the primary use is Internet applications. Because the mean hours for talk time usage is greater than the mean hours for Internet usage, the question was raised as to whether the variance in hours of usage is also greater when the primary use is talk time. Sample data showing battery life between charges for the two applications follows. 1)Test whether the variance is also greater when the primary use is talk time
- in refence of staticstics 1. What is the relationship between samples and populations?An investigator collected the following data with respect to the Corona virus cases and death in the United State America. The results are shown in following table. Date America Corona Cases Death 1-Jun-20 22153 730 31-May-20 20350 638 30-May-20 23290 1015 29-May-20 25069 1212 28-May-20 22658 1223 27-May-20 20546 1535 26-May-20 20121 1432 a- Plot scatter diagram between Corona cases and death. b- Find the regression equation of death to Corona cases. c- Estimate the death for 24000 Corona cases.a sample of 60 grade 9 student age was obtained to estimate the mean age of all grade 9 students. x = 15.3 years and the population variance is 16
- Each year, marketing and information firm J.D. Power and Associates surveys new car owners 90 days after they have purchased their cars. The data collected are used to rate auto brands (Toyota, Ford, and others) on initial quality and initial customer satisfaction. USA Today reported both the number of manufacturing defects per 100 vehicles and a satisfaction score for all 33 brands sold in the United States.† A research group decides to compare the mean number of defects for 2 specific models of cars, A and B, made this year by taking random samples of 100 cars of each model. (a) After collecting the data, the research group calculates a 95% confidence interval to estimate the difference in population means. In this case, what is the population? all cars for models A and B that were produced this yearthe defects all cars made this yearthe 100 cars from each model (b) Suppose the calculated confidence interval is (84, 92) number of defects. What is the value of the point…The U.S. Census Bureau computes quarterly vacancy and homeownership rates by state and metropolitan statistical area. Each metropolitan statistical area has at least one urbanized area of 50,000 or more inhabitants. The data in Sheet 10 are the rental vacancy rates (%) for metropolitan statistical area in four geographic regions of the U.S. for the first quarter of 2008. Use alpha = 0.05 to test whether the mean vacancy rate is the same for each geographic region. Sheet 10 Midwest Northeast South West 16,2 2,7 16,6 7,9 10,1 11,5 8,5 6,6 8,6 6,6 12,1 6,9 12,3 7,9 9,8 5,6 10 5,3 9,3 4,3 16,9 10,7 9,1 15,2 16,9 8,6 5,6 5,7 5,4 5,5 9,4 4 18,1 12,7 11,6 12,3 11,9 8,3 15,6 3,6 11 6,7 18,3 11 9,6 14,2 13,4 12,1 7,6 1,7 6,5 8,7 12,9 3,6 11,4 5 12,2 11,5 13,1 4,7 13,6 16,3 4,4 3,3 8,2 3,4 24 5,5 12,2 22,6 12 14,5 12,6 9,5 10,1 Select one: a) Sum of Squares Between Groups = 376.87 >…A pet food producer manufactures and then fills 25-pound bags of dog food on two different production lines located in separate cities. In an effort to determine whether differences exist between the average fill rates for the two lines, a random sample of 19 bags from line 1 and a random sample of 23 bags from line 2 were recently selected. Each bag’s weight was measured and the following summary measures from the samples were reported: Production Line 1 Production Line 2 Sample Size, n 19 23 Sample Mean, x 24.96 25.01 Sample Standard Deviation, s 0.07 0.08 Management believes that the fill rates of the two lines are normally distributed with equal variances. a) Calculate the point estimate for the difference between the population means of the two lines. b) Develop a 95% confidence interval…
