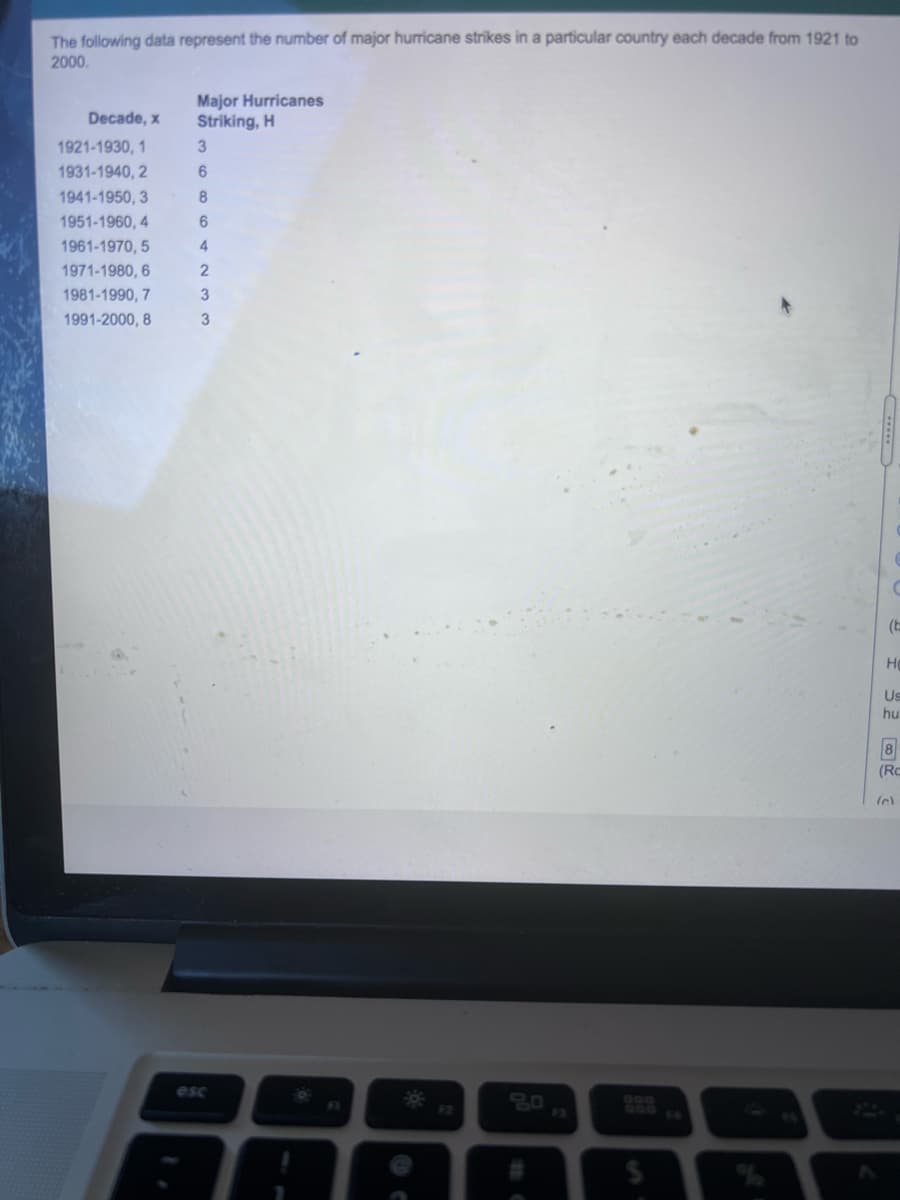
The following data represent the number of major hurricane strikes in a particular country each decade from 1921 tor 2000. Major Hurricanes Striking, H Decade, x 1921-1930, 1 1931-1940, 2 1941-1950, 3 8 1951-1960, 4 1961-1970, 5 4 1971-1980, 6 1981-1990, 7 1991-2000, 8 3
The following data represent the number of major hurricane strikes in a particular country each decade from 1921 tor 2000. Major Hurricanes Striking, H Decade, x 1921-1930, 1 1931-1940, 2 1941-1950, 3 8 1951-1960, 4 1961-1970, 5 4 1971-1980, 6 1981-1990, 7 1991-2000, 8 3

Glencoe Algebra 1, Student Edition, 9780079039897, 0079039898, 2018
18th Edition
ISBN:9780079039897
Author:Carter
Publisher:Carter
Chapter10: Statistics
Section10.1: Measures Of Center
Problem 9PPS

Related questions
Question
B, C,D help please
Transcribed Image Text:The following data represent the number of major hurricane strikes in a particular country each decade from 1921 to
2000.
Major Hurricanes
Striking, H
Decade, x
1921-1930, 1
1931-1940, 2
1941-1950, 3
8
1951-1960, 4
1961-1970, 5
1971-1980, 6
1981-1990, 7
3
1991-2000, 8
3
(b
Ho
Us
hu
8
(RC
esc
80
Doo
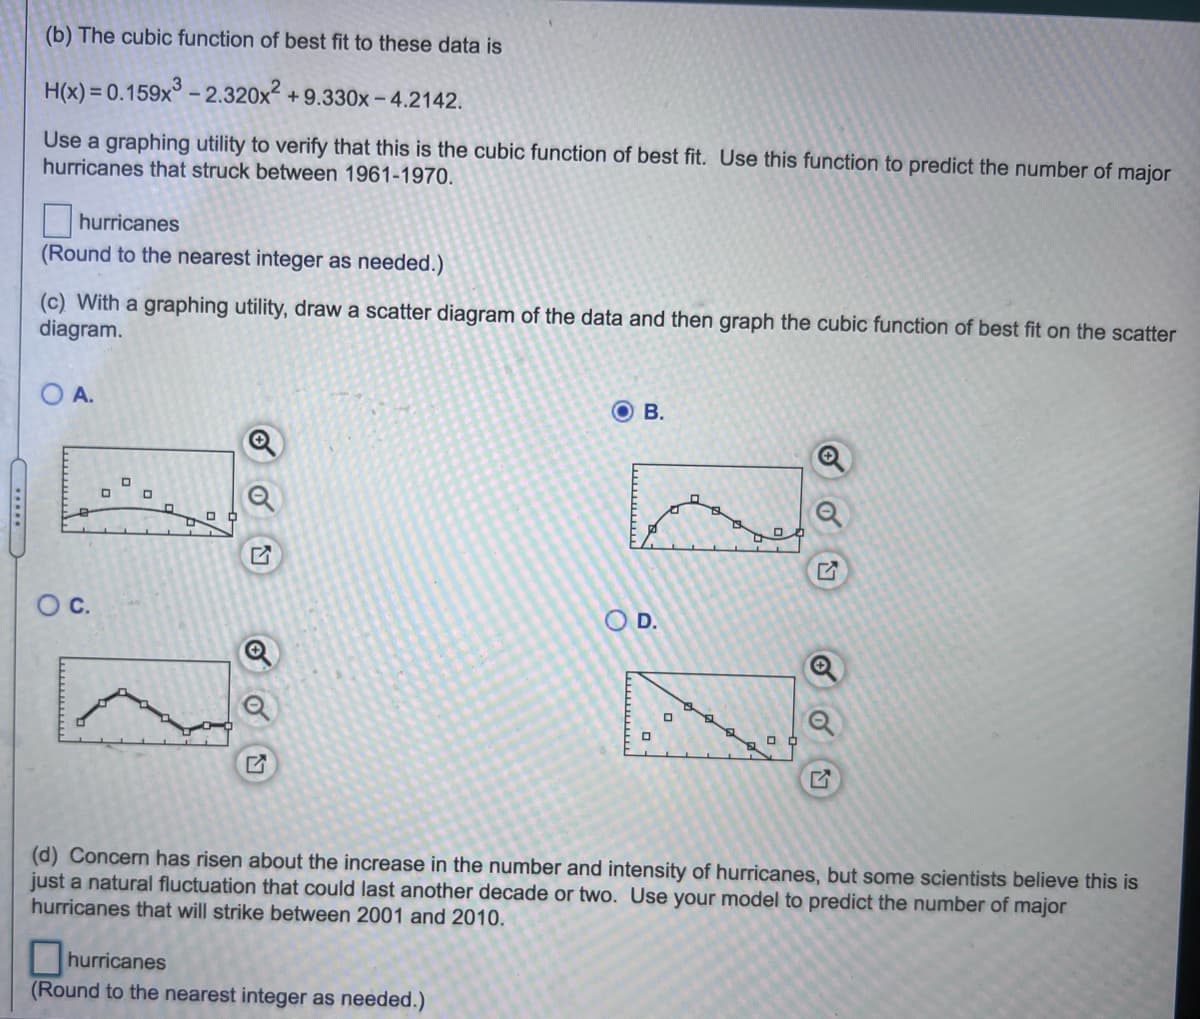
Transcribed Image Text:(b) The cubic function of best fit to these data is
H(x) = 0.159x° - 2.320x2 + 9.330x - 4.2142.
Use a graphing utility to verify that this is the cubic function of best fit. Use this function to predict the number of major
hurricanes that struck between 1961-1970.
hurricanes
(Round to the nearest integer as needed.)
(c) With a graphing utility, draw a scatter diagram of the data and then graph the cubic function of best fit on the scatter
diagram.
O A.
O B.
Oc.
O D.
(d) Concern has risen about the increase in the number and intensity of hurricanes, but some scientists believe this is
just a natural fluctuation that could last another decade or two. Use your model to predict the number of major
hurricanes that will strike between 2001 and 2010.
hurricanes
(Round to the nearest integer as needed.)
wwwww
Expert Solution
This question has been solved!
Explore an expertly crafted, step-by-step solution for a thorough understanding of key concepts.

This is a popular solution!

Trending now
This is a popular solution!

Step by step
Solved in 4 steps with 3 images

Recommended textbooks for you
Glencoe Algebra 1, Student Edition, 9780079039897…
Algebra
ISBN:
9780079039897
Author:
Carter
Publisher:
McGraw Hill

Holt Mcdougal Larson Pre-algebra: Student Edition…
Algebra
ISBN:
9780547587776
Author:
HOLT MCDOUGAL
Publisher:
HOLT MCDOUGAL
Glencoe Algebra 1, Student Edition, 9780079039897…
Algebra
ISBN:
9780079039897
Author:
Carter
Publisher:
McGraw Hill
Holt Mcdougal Larson Pre-algebra: Student Edition…
Algebra
ISBN:
9780547587776
Author:
HOLT MCDOUGAL
Publisher:
HOLT MCDOUGAL