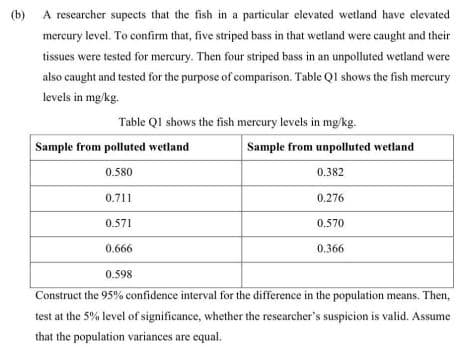
(b) A rescarcher supects that the fish in a particular elevated wetland have elevated mercury level. To confirm that, five striped bass in that wetland were caught and their tissues were tested for mercury. Then four striped bass in an unpolluted wetland were also caught and tested for the purpose of comparison. Table QI shows the fish mercury levels in mg/kg. Table Ql shows the fish mercury levels in mgkg. Sample from polluted wetland Sample from unpolluted wetland 0.580 0.382 0.711 0.276 0.571 0.570 0.666 0.366 0.598 Construct the 95% confidence interval for the difference in the population means. Then, test at the 5% level of significance, whether the researcher's suspicion is valid. Assume that the population variances are equal.
(b) A rescarcher supects that the fish in a particular elevated wetland have elevated mercury level. To confirm that, five striped bass in that wetland were caught and their tissues were tested for mercury. Then four striped bass in an unpolluted wetland were also caught and tested for the purpose of comparison. Table QI shows the fish mercury levels in mg/kg. Table Ql shows the fish mercury levels in mgkg. Sample from polluted wetland Sample from unpolluted wetland 0.580 0.382 0.711 0.276 0.571 0.570 0.666 0.366 0.598 Construct the 95% confidence interval for the difference in the population means. Then, test at the 5% level of significance, whether the researcher's suspicion is valid. Assume that the population variances are equal.

Glencoe Algebra 1, Student Edition, 9780079039897, 0079039898, 2018
18th Edition
ISBN:9780079039897
Author:Carter
Publisher:Carter
Chapter10: Statistics
Section10.3: Measures Of Spread
Problem 1GP

Related questions

Topic Video
Question
Transcribed Image Text:(b) A rescarcher supccts that the fish in a particular elevated wetland have elevated
mercury level. To confirm that, five striped bass in that wetland were caught and their
tissues were tested for mercury. Then four striped bass in an unpolluted wetland were
also caught and tested for the purpose of comparison. Table QI shows the fish mercury
levels in mg/kg.
Table QI shows the fish mercury levels in mg/kg.
Sample from polluted wetland
Sample from unpolluted wetland
0.580
0.382
0.711
0.276
0.571
0.570
0.666
0.366
0.598
Construct the 95% confidence interval for the difference in the population means. Then,
test at the 5% level of significance, whether the researcher's suspicion is valid. Assume
that the population variances are equal.
Expert Solution
This question has been solved!
Explore an expertly crafted, step-by-step solution for a thorough understanding of key concepts.

Step by step
Solved in 3 steps with 4 images

Knowledge Booster


Learn more about
Need a deep-dive on the concept behind this application? Look no further. Learn more about this topic, statistics and related others by exploring similar questions and additional content below.Recommended textbooks for you
Glencoe Algebra 1, Student Edition, 9780079039897…
Algebra
ISBN:
9780079039897
Author:
Carter
Publisher:
McGraw Hill

Holt Mcdougal Larson Pre-algebra: Student Edition…
Algebra
ISBN:
9780547587776
Author:
HOLT MCDOUGAL
Publisher:
HOLT MCDOUGAL
Glencoe Algebra 1, Student Edition, 9780079039897…
Algebra
ISBN:
9780079039897
Author:
Carter
Publisher:
McGraw Hill
Holt Mcdougal Larson Pre-algebra: Student Edition…
Algebra
ISBN:
9780547587776
Author:
HOLT MCDOUGAL
Publisher:
HOLT MCDOUGAL