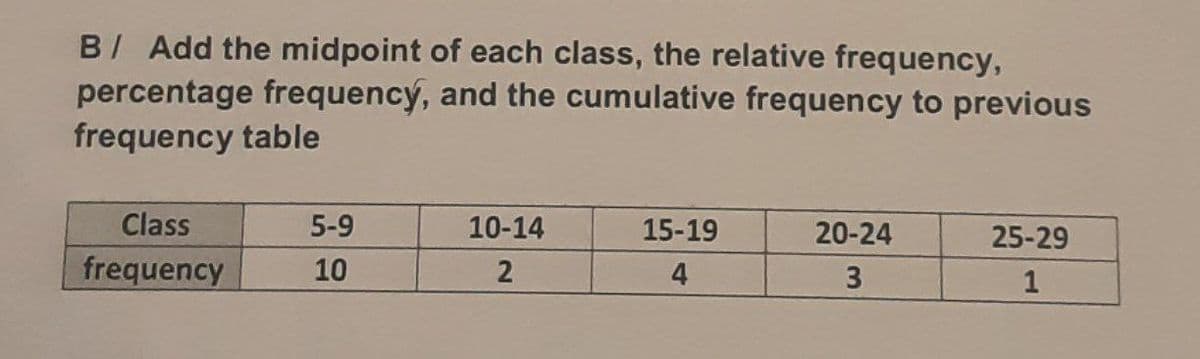
B Add the midpoint of each class, the relative frequency, percentage frequency, and the cumulative frequency to previous frequency table Class 5-9 10-14 15-19 20-24 25-29 frequency 10 4 1


Q: Construct a frequency distribution for the given data set using 6 classes. In the table, include the…
A:
Q: A histogram is a graph that represents the cumulative frequencies for the categories in a frequency…
A: Histogram is s graph in which we plot frequency of a categories on y- axis. And categories are on x…
Q: A frequency table of grades has five classes (A, B, C, D, F) with frequencies of 5, 10, 17,…
A: The given table is Grade Frequency A 5 B 10 C 17 D 5 F 3
Q: Exam scores for 30 students: 21 51 64 68 70 74 77 78 81 83 83 85 87 87 87 91 92 92 92 92 93 93 94…
A: Class Frequency 20-29 1 30-39 0 40-49 0 50-59 1 60-69 2 70-79 4 80-89 7 90-99 15
Q: Using the data below make a frequency distribution table containing the following: 1. classes with…
A: Frequency distribution table : A distribution table is one approach to organize knowledge to form it…
Q: Ages Number of students 15-18 4. 19-22 10 23-26 10 27-30 31-34 35-38 Based on the frequency…
A: From the given table, The total frequency is 4+10+10+6+8+5=43 The frequency value for the class with…
Q: 2. Construct a frequency distribu lowing set of scores. Include and percentage in your tables 5 7 8…
A: Here construct frequency distribution Table from given dataset of scores Xi = score fi = frequency…
Q: Fifty-one (51) statistics students were asked how much sleep they get per school night (rounded to…
A: The following frequency distribution table is given: Values (x) Frequency (f) Cumulative…
Q: Complete the relative frequency distribution below. Relative Cause Frequency Pilot error 46.4 %…
A: Relative frequency= Frequency of the class*100/total frequency %
Q: 7. For items 7-10, refer to table A below Table A Cumulative Cumulative Score Frequency Frequency…
A: The k-th percentile of a distribution corresponds to a point with the property that k% of the…
Q: L. Given the scores obtained by 15 students in Math Quiz. Construct a frequency table without…
A: Solution-: Given data: 12,15,10,10,15,8,11,13,10,14,10,9,11,14,15 We want to find (1) The value…
Q: Nineteen people were asked how many miles, to the nearest mile, they commute to work each day. The…
A: We have given that the data of 19 people were asked how many miles they commute to work each day.…
Q: Construct the grouped frequency table for the student's ages with 10 classes. Also compute,…
A: Obtain the grouped frequency distribution table. The grouped frequency table is obtained below as…
Q: 49 33 33 34 33 46 55 39 30 34 24 36 27 35 19 34 29 31 31 29 57 50 39 45 53 44 50 45 32 36 23 42 50…
A: Obtain the frequency distribution table. The Frequency distribution table is obtained below as…
Q: BỊ Add the midpoint of each class, the relative frequency, percentage frequency, and the cumulative…
A: Given: Class Frequency 5-9 10 10-14 2 15-19 4 20-24 3 25-29 1 Total 20
Q: (a) Construct a stem-and-leaf graph for the given data. (b) Draw a table with the relative…
A: As per our guidelines, we are allowed to answer first three sub-parts only. Thanks Given Data : a)…
Q: a. Construct a frequency distribution and a percentage distribution. b. Construct a cumulative…
A: a. The frequency of each class is obtained by counting the number of times each data point appeared…
Q: unufacturing company are shown below in a frequency distribution table. Hourly rates 30-32 33-35 No.…
A: Givan Hello. Since your question has multiple parts, we will solve first 4 sub parts question for…
Q: Ages Number of students 15-18 19-22 23-26 8 27-30 31-34 35-38 Based on the frequency distribution…
A: Note: In the class interval of a--b, Here, a represents the lower class limit and the upper class…
Q: b) Using the results from part a, calculate the relative frequencies for each class. c) Using the…
A: We have given that Rating Frequency Excellent (E) 14 Good (G) 23 Fair(F) 10 Poor (P) 13
Q: BI Add the midpoint of each class, the relative frequency, percentage frequency, and the cumulative…
A: Let us notation Cf=Cumulative Frequency F=frequency CI=Class interval
Q: Construct a frequency distribution for the given data set using 6 classes. In the table, include the…
A:
Q: Find frequency histogram, frequency polygon, frequency Cumulative Curve ( less than) and percentage…
A:
Q: The data below are the number of students in each age group. Ages Number of students 15-18 10 19-22…
A: Given Information: To find out the relative frequency for the class with lower class limit 19.
Q: Assume you are a realtor in Bradenton, Florida. You have recently obtained a listing of the selling…
A: Number of class =5 Minimum value = 67900 Maximum value=321550 Class width =Range / Number of class…
Q: Construct a frequency distribution for the given data set using 6 classes. In the table, include the…
A: Frequency distribution: The number of values lying in the particular interval or the number of times…
Q: 1- Ages of the Vice Presidents at the Time of Their Death The ages of the Vice Presidents of the…
A: As per guidelines, we will only solve first question, please repost other questions for more…
Q: 10+ 8 6. 2 9 11 13 5 7 9. data Based on the histogram above, what is the frequency of the class…
A: Given information- We have given the Histogram. We have to find the frequency of the class…
Q: 3. Complete the frequency distribution table and answer the questions below. Class Intervals…
A: Class intervals Frequency (f) Midpoints (X) Frequency . Midpoints (f.X) 300-319 1 309.5 309.5…
Q: 5 21 7 10 The data represent the time, in minutes, spent reading a political blog in a day.…
A: Class Interval Frequency Midpoint Relative Frequency Cumulative frequency 0-9 8 (0+9)/2=4.5 8/20=…
Q: Question a. Prepare a cumulative frequency distribution. b. Calculate the cumulative relative…
A: Frequency is the counts of observation occur in the data set. Relative frequency represent the…
Q: B/ Add the midpoint of each class, the relative frequency, percentage frequency, and the cumulative…
A: We have to add given collumns in table.
Q: A frequency table of grades has five classes (A, B, C, D, F) with frequencies of 2, 10, 13, 4, and 3…
A: Note: Since you have posted multiple independent questions in the same request, we will solve the…
Q: 2- The ages of the Vice Presidents of the United States at the time of their death are listed below.…
A:
Q: Frank wishes to view a frequency table for grouped data using the following investment rates (in…
A: Solution : Frequency Table Class Count 3.5-4.7 2 4.8-6 1 6.1-7.3 4 7.4-8.6 2 8.7-9.9…
Q: 49 33 33 34 33 46 55 39 30 34 24 36 27 35 19 34 29 31 31 29 57 50 39 45 53 44 50 45 32 36 23 42 50…
A: "Since you have posted a question with multiple subparts, we will solve first 3 sub-parts for you.…
Q: The table below shows the monthly incomes (in thousands) of Mr. Adam. 11 56 | 43 21 11 12 11 10 | 48…
A: Since you have posted a question with multiple subparts, we will solve first three subparts for you.…
Q: Construct the cumulative frequency distribution that corresponds to the given frequency…
A: Given Data, Speed Number of cars 0-29 4 30-59 16 60-89 60 90-119 20 Total 100
Q: Use the cumulative frequency table on the left(top) to fill in the table on the right.(bottom)…
A: Formula for relative frequency is given by: Relative frequency = (Frequency/ Total frequency)
Q: 2. The number of class intervals in a frequency distribution (or bar chart) will be approximately…
A: Range = Maximum -Minimum
Q: Find frequency histogram, frequency polygon, frequency Cumulative Curve ( less than) and percentage…
A:
Q: A frequency table of grades has five classes (A, B, C, D, F) with frequencies of 3, 11, 16, 7, and 1…
A: Formula Used: Relative frequency = Fn Where, F is the frequency and n is the sum of frequency.
Q: C.W: The following frequency table represent the number of iPods sold within 30 days. IPods sold No.…
A: As per our guidelines we are allowed to answer only three subparts of a question. Kindly repost the…
Q: Find the mean from the frequency table below. Classes Frequency 10-14 8 15-19 29…
A: Class Frequency (f) Mid value (x) f⋅x 10-14 8 12 96 15-19 29 17 493 20-24 42 22 924 25-29 7…
Q: Construct a frequency distribution and a relative frequency histogram for the data set using five…
A: The minimum and maximum scores are 52 and 75, respectively. There are total 24 observations. The…
Q: Construct one table that includes relative frequencies based on the frequency distributions shown…
A: Given: Tar Non filtered frequency 13-17 2 18-22 0 23-27 13 28-32 6 33-37 4…
Q: Construct one table that includes relative frequencies based on the frequency distributions shown…
A: Given Total frequency in Non-filtered cigarettes = 2 + 0 + 14 + 7 + 2 = 25 Total frequency in…
Q: Construct a frequency distribution and a relative frequency histogram for the accompanying data set…
A: A frequency distribution is a representation of data in the tabular, listed or graphical form. It…
Q: 4.6 4.6 4.4 4.5 4.3 4.7 4.9 4.6 4.6 4.6 4.5 4.7 4.5 4.5 4.6 4.6 4.6 4.8 1. Use the ungrouped data…
A:
Q: 4.6 4.6 4.4 4.5 4.3 4.7 4.9 4.6 4.6 4.6 4.5 4.7 4.5 4.5 4.6 4.6 4.6 4.8 1. Use the ungrouped data…
A: Answer:Given that here, the ungrouped data We have to arrange the data into class interval a.…

Step by step
Solved in 2 steps with 1 images
