b) Using the results from part a, calculate the relative frequencies for each class. c) Using the results from part a, calculate the cumulative relative frequencies for each class. d) Construct a horizontal bar chart for these data. e) What percentage of customers rated their dining experience as either Excellent or Good? Click the icon to view the table of the customer experience ratings. a) Construct a frequency distribution. Frequency Rating Excellent (E) 14 23 Good (G) Fair (F) Poor (P) 10 13 b) Calculate the relative frequencies. Rating Excellent (E) Relative Frequency 0.233 Good (G) 0.383 Fair (F) 0.167 Poor (P) 0.217 (Round to three decimal places as needed.) c) Calculate the cumulative relative frequencies. Rating Cumulative Relative Frequency Excellent (E) Good (G) Fair (F) Poor (P) (Round to three decimal places as needed.) Customer experience ratings E E G G G E F F G G G G G G G E P P P E Р G P E P G F FE G Print P G P E E F F F FEE ... G E Done G E F F G P G P G G E G G G P P P - X
b) Using the results from part a, calculate the relative frequencies for each class. c) Using the results from part a, calculate the cumulative relative frequencies for each class. d) Construct a horizontal bar chart for these data. e) What percentage of customers rated their dining experience as either Excellent or Good? Click the icon to view the table of the customer experience ratings. a) Construct a frequency distribution. Frequency Rating Excellent (E) 14 23 Good (G) Fair (F) Poor (P) 10 13 b) Calculate the relative frequencies. Rating Excellent (E) Relative Frequency 0.233 Good (G) 0.383 Fair (F) 0.167 Poor (P) 0.217 (Round to three decimal places as needed.) c) Calculate the cumulative relative frequencies. Rating Cumulative Relative Frequency Excellent (E) Good (G) Fair (F) Poor (P) (Round to three decimal places as needed.) Customer experience ratings E E G G G E F F G G G G G G G E P P P E Р G P E P G F FE G Print P G P E E F F F FEE ... G E Done G E F F G P G P G G E G G G P P P - X

Mathematics For Machine Technology
8th Edition
ISBN:9781337798310
Author:Peterson, John.
Publisher:Peterson, John.
Chapter29: Tolerance, Clearance, And Interference
Section: Chapter Questions
Problem 20A: Mating parts are shown in Figure 29-16. The pins in the top piece fit into the holes in the bottom...

Related questions
Question
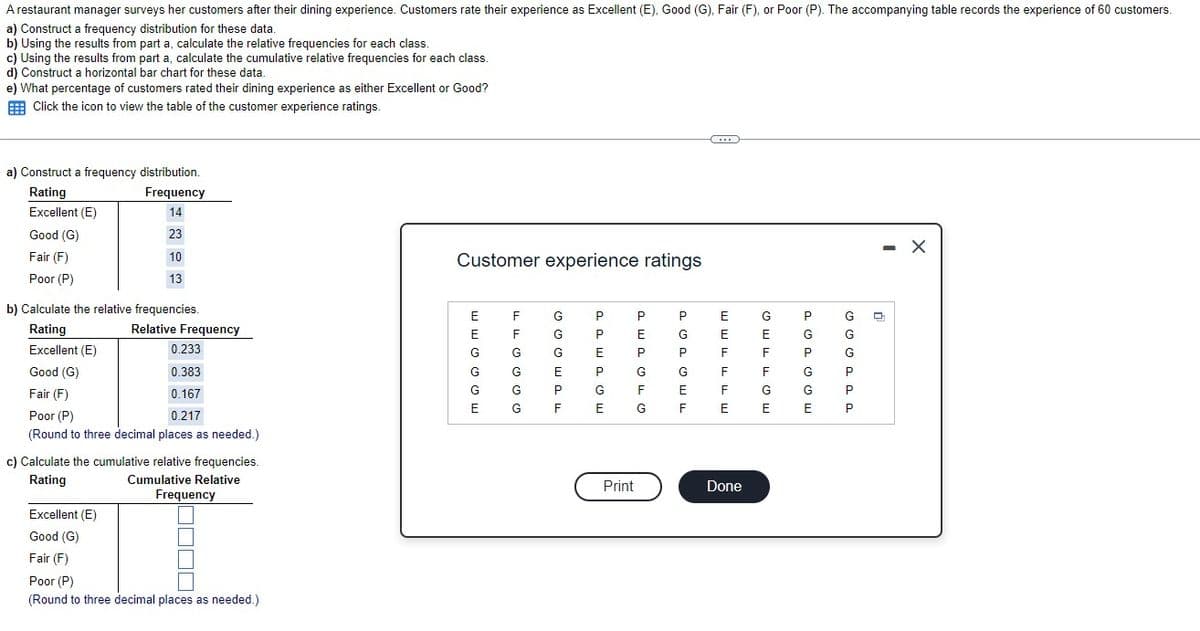
A restaurant manager surveys her customers after their dining experience. Customers rate their experience as Excellent (E), Good (G), Fair (F), or Poor (P). The accompanying table records the experience of 60 customers. Solve part C.
Transcribed Image Text:A restaurant manager surveys her customers after their dining experience. Customers rate their experience as Excellent (E), Good (G), Fair (F), or Poor (P). The accompanying table records the experience of 60 customers.
a) Construct a frequency distribution for these data.
b) Using the results from part a, calculate the relative frequencies for each class.
c) Using the results from part a, calculate the cumulative relative frequencies for each class.
d) Construct a horizontal bar chart for these data.
e) What percentage of customers rated their dining experience as either Excellent or Good?
Click the icon to view the table of the customer experience ratings.
a) Construct a frequency distribution.
Frequency
Rating
Excellent (E)
14
23
10
13
Good (G)
Fair (F)
Poor (P)
b) Calculate the relative frequencies.
Rating
Excellent (E)
Relative Frequency
0.233
Good (G)
0.383
Fair (F)
0.167
Poor (P)
0.217
(Round to three decimal places as needed.)
c) Calculate the cumulative relative frequencies.
Rating
Cumulative Relative
Frequency
Excellent (E)
Good (G)
Fair (F)
Poor (P)
(Round to three decimal places as needed.)
Customer experience ratings
E
E
G
G
G
F
F
G
G
G
EG
G
G
G
E
P
P
P
E
P
G
FEG
P
E
P
Print
G
F
P
G
P
G
E
E
E
F
G
E
F
F
F
FEE
Done
F
G
P
G
P
G
G
E
G
G
G
P
P
P
-
Q
Expert Solution
This question has been solved!
Explore an expertly crafted, step-by-step solution for a thorough understanding of key concepts.

This is a popular solution!

Trending now
This is a popular solution!

Step by step
Solved in 3 steps

Recommended textbooks for you
Mathematics For Machine Technology
Advanced Math
ISBN:
9781337798310
Author:
Peterson, John.
Publisher:
Cengage Learning,

Big Ideas Math A Bridge To Success Algebra 1: Stu…
Algebra
ISBN:
9781680331141
Author:
HOUGHTON MIFFLIN HARCOURT
Publisher:
Houghton Mifflin Harcourt

Holt Mcdougal Larson Pre-algebra: Student Edition…
Algebra
ISBN:
9780547587776
Author:
HOLT MCDOUGAL
Publisher:
HOLT MCDOUGAL
Mathematics For Machine Technology
Advanced Math
ISBN:
9781337798310
Author:
Peterson, John.
Publisher:
Cengage Learning,
Big Ideas Math A Bridge To Success Algebra 1: Stu…
Algebra
ISBN:
9781680331141
Author:
HOUGHTON MIFFLIN HARCOURT
Publisher:
Houghton Mifflin Harcourt
Holt Mcdougal Larson Pre-algebra: Student Edition…
Algebra
ISBN:
9780547587776
Author:
HOLT MCDOUGAL
Publisher:
HOLT MCDOUGAL

Glencoe Algebra 1, Student Edition, 9780079039897…
Algebra
ISBN:
9780079039897
Author:
Carter
Publisher:
McGraw Hill

Elementary Geometry For College Students, 7e
Geometry
ISBN:
9781337614085
Author:
Alexander, Daniel C.; Koeberlein, Geralyn M.
Publisher:
Cengage,