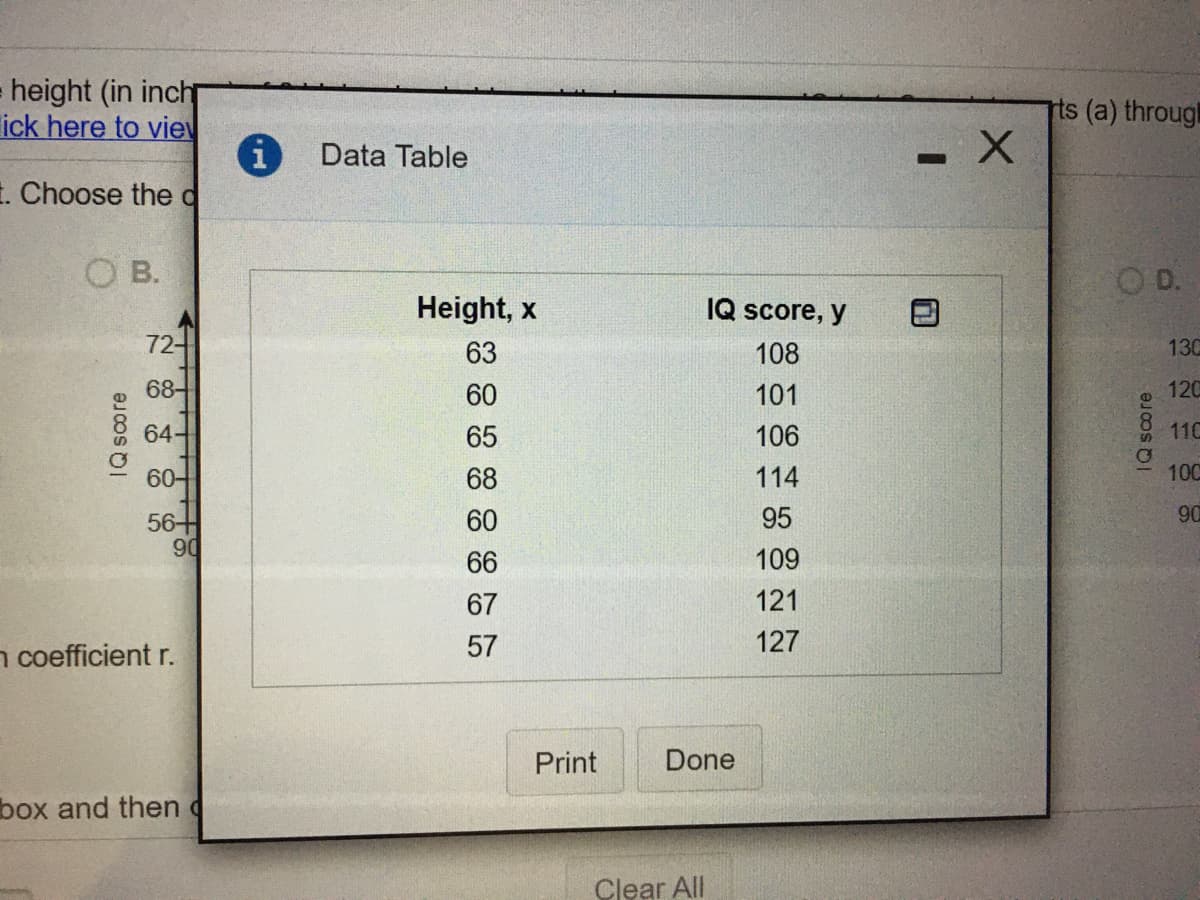
(b) Calculate the sample correlation coefficient r.​(c) Describe the type of​ correlation, if​ any, and interpret the correlation in the context of the data

Glencoe Algebra 1, Student Edition, 9780079039897, 0079039898, 2018
18th Edition
ISBN:9780079039897
Author:Carter
Publisher:Carter
Chapter4: Equations Of Linear Functions
Section4.6: Regression And Median-fit Lines
Problem 1AGP
icon
Related questions
icon
Concept explainers
Question
​(b) Calculate the sample correlation coefficient r. ​(c) Describe the type of​ correlation, if​ any, and interpret the correlation in the context of the data. ​(d) Use the table of critical values for the Pearson correlation coefficient to make a conclusion about the correlation coefficient.
height (in inch
ick here to viev
rts (a) through
Data Table
1. Choose thed
O B.
O D.
Height, x
IQ score, y
72
63
108
13C
68-
60
101
120
64
65
106
11C
60-
68
114
10C
60
95
90
56+
90
66
109
67
121
n coefficient r.
57
127
Print
Done
box and then
Clear All
Q soore
IQ score
Transcribed Image Text:height (in inch ick here to viev rts (a) through Data Table 1. Choose thed O B. O D. Height, x IQ score, y 72 63 108 13C 68- 60 101 120 64 65 106 11C 60- 68 114 10C 60 95 90 56+ 90 66 109 67 121 n coefficient r. 57 127 Print Done box and then Clear All Q soore IQ score
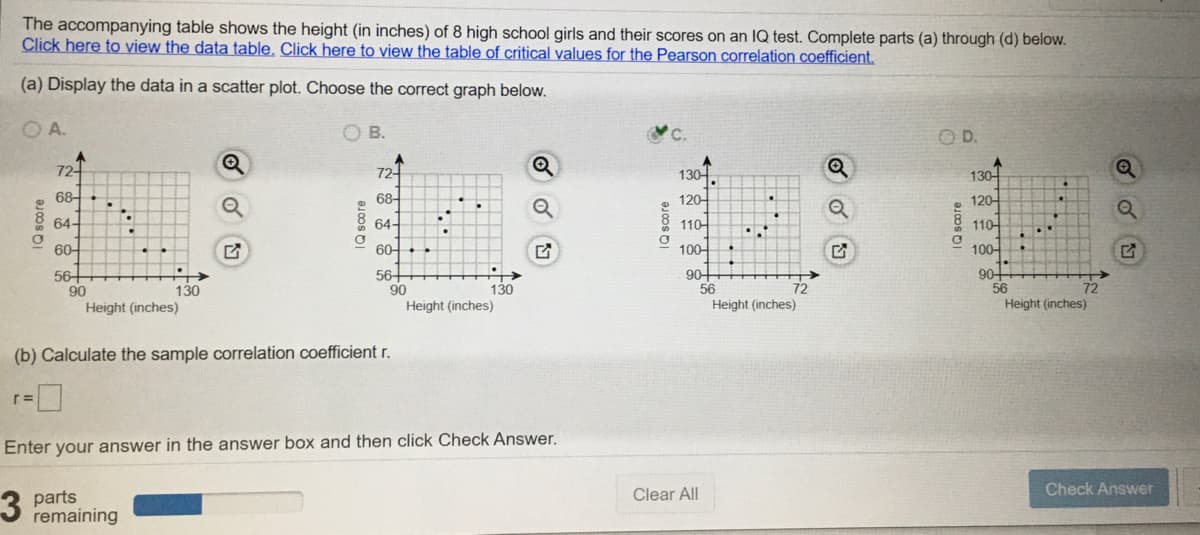
The accompanying table shows the height (in inches) of 8 high school girls and their scores on an IQ test. Complete parts (a) through (d) below.
Click here to view the data table. Click here to view the table of critical values for the Pearson correlation coefficient.
(a) Display the data in a scatter plot. Choose the correct graph below.
O A.
O B.
OD.
72-
72-
130-.
130-
68-.
12어
120-
110-
68-
64-
64-
110-
60-
6어 +
100-
100-
56+
90
56+
90
90-
56
Height (inches)
90
56
Height (inches)
130
130
72
Height (inches)
Height (inches)
(b) Calculate the sample correlation coefficient r.
Enter your answer in the answer box and then click Check Answer.
Check Answer
3 parts
remaining
Clear All
1Q score
IQ score
Q score
Transcribed Image Text:The accompanying table shows the height (in inches) of 8 high school girls and their scores on an IQ test. Complete parts (a) through (d) below. Click here to view the data table. Click here to view the table of critical values for the Pearson correlation coefficient. (a) Display the data in a scatter plot. Choose the correct graph below. O A. O B. OD. 72- 72- 130-. 130- 68-. 12어 120- 110- 68- 64- 64- 110- 60- 6어 + 100- 100- 56+ 90 56+ 90 90- 56 Height (inches) 90 56 Height (inches) 130 130 72 Height (inches) Height (inches) (b) Calculate the sample correlation coefficient r. Enter your answer in the answer box and then click Check Answer. Check Answer 3 parts remaining Clear All 1Q score IQ score Q score
Expert Solution
trending now

Trending now

This is a popular solution!

steps

Step by step

Solved in 5 steps with 1 images

Blurred answer
Knowledge Booster
Correlation, Regression, and Association
Learn more about
Need a deep-dive on the concept behind this application? Look no further. Learn more about this topic, statistics and related others by exploring similar questions and additional content below.
Recommended textbooks for you
Glencoe Algebra 1, Student Edition, 9780079039897…
Algebra
ISBN:
9780079039897
Author:
Carter
Publisher:
McGraw Hill
Big Ideas Math A Bridge To Success Algebra 1: Stu…
Algebra
ISBN:
9781680331141
Author:
HOUGHTON MIFFLIN HARCOURT
Publisher:
Houghton Mifflin Harcourt
Holt Mcdougal Larson Pre-algebra: Student Edition…
Algebra
ISBN:
9780547587776
Author:
HOLT MCDOUGAL
Publisher:
HOLT MCDOUGAL