b) Given the following data: Month Sales Month Sales July August September 38.0 October 35.0 January February March 25.0 31.0 32.0 29.0 April May June 33.0 40.0 November 37.0 December 32.0 34.0 37.0 Required: • With a six-month warm-up sample, determine monthly forecasts using: i. ii. Naïve Model Three-month Moving Average Weighted Average Exponential Smoothing ( a = 0.40) Linear Regression ii. iv. V. • For each models above, calculate: i. ii. MAD MSE With MSE as basis, which of the models do you think is superior?
b) Given the following data: Month Sales Month Sales July August September 38.0 October 35.0 January February March 25.0 31.0 32.0 29.0 April May June 33.0 40.0 November 37.0 December 32.0 34.0 37.0 Required: • With a six-month warm-up sample, determine monthly forecasts using: i. ii. Naïve Model Three-month Moving Average Weighted Average Exponential Smoothing ( a = 0.40) Linear Regression ii. iv. V. • For each models above, calculate: i. ii. MAD MSE With MSE as basis, which of the models do you think is superior?

Glencoe Algebra 1, Student Edition, 9780079039897, 0079039898, 2018
18th Edition
ISBN:9780079039897
Author:Carter
Publisher:Carter
Chapter4: Equations Of Linear Functions
Section: Chapter Questions
Problem 8SGR

Related questions
Question
100%
I'll upvote if complete and typewritten. Do not answer if you already answered this, i'll downvote. Thank you
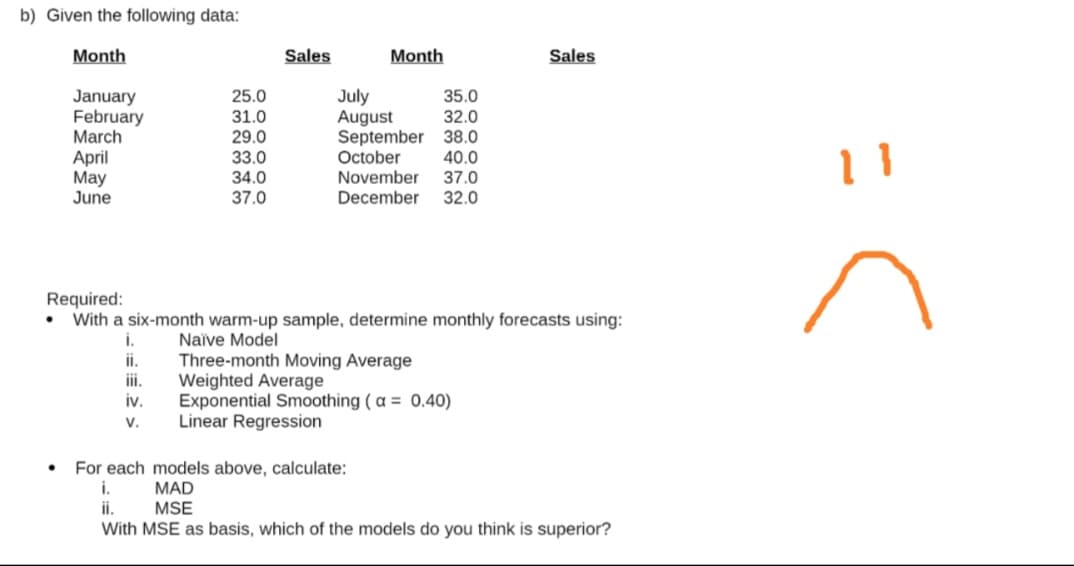
Transcribed Image Text:b) Given the following data:
Month
Sales
Month
Sales
July
August
September 38.0
October
November
25.0
35.0
January
February
March
31.0
32.0
29.0
April
May
June
33.0
40.0
34.0
37.0
37.0
32.0
December
Required:
With a six-month warm-up sample, determine monthly forecasts using:
Naïve Model
Three-month Moving Average
Weighted Average
Exponential Smoothing ( a = 0.40)
Linear Regression
i.
i.
ii.
iv.
V.
For each models above, calculate:
i.
MAD
i.
MSE
With MSE as basis, which of the models do you think is superior?
Expert Solution
This question has been solved!
Explore an expertly crafted, step-by-step solution for a thorough understanding of key concepts.

This is a popular solution!

Trending now
This is a popular solution!

Step by step
Solved in 4 steps

Recommended textbooks for you
Glencoe Algebra 1, Student Edition, 9780079039897…
Algebra
ISBN:
9780079039897
Author:
Carter
Publisher:
McGraw Hill
Glencoe Algebra 1, Student Edition, 9780079039897…
Algebra
ISBN:
9780079039897
Author:
Carter
Publisher:
McGraw Hill