(b) How many MVPS played short stop (SS)? MVPS played short stop. (c) How many more MVPS played outfield (OF) than short stop? more MVPS played outfield than short stop. (Type a whole number.) (d) There are three outfield positions (left field, center field, right field). Given this, how might the graph be misleading? O A. The positions or combinations of positions should be chosen so that all the bars are closer together in height. O B. The graph is misleading because the bars are decreasing in height from left to right. OC. The chart seems to show that one position has many more MVPS because three positions are combined into one. They should be separated. O D. All the information is true, so the graph is not misleading.
(b) How many MVPS played short stop (SS)? MVPS played short stop. (c) How many more MVPS played outfield (OF) than short stop? more MVPS played outfield than short stop. (Type a whole number.) (d) There are three outfield positions (left field, center field, right field). Given this, how might the graph be misleading? O A. The positions or combinations of positions should be chosen so that all the bars are closer together in height. O B. The graph is misleading because the bars are decreasing in height from left to right. OC. The chart seems to show that one position has many more MVPS because three positions are combined into one. They should be separated. O D. All the information is true, so the graph is not misleading.

Chapter8: Sequences, Series,and Probability
Section8.7: Probability
Problem 6ECP: In Pennsylvania’s Cash 5 game, a player chooses five different numbers from 1 to 43. If these five...

Related questions
Question
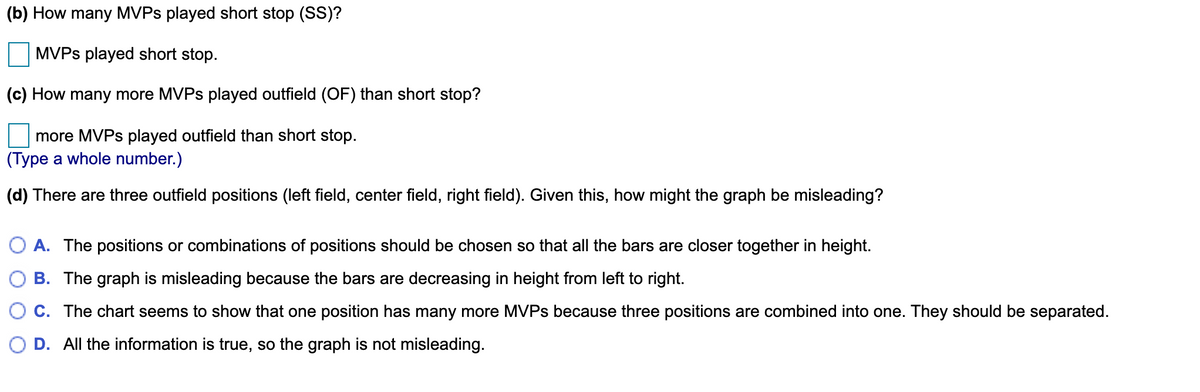
Transcribed Image Text:(b) How many MVPS played short stop (SS)?
MVPS played short stop.
(c) How many more MVPS played outfield (OF) than short stop?
more MVPS played outfield than short stop.
(Type a whole number.)
(d) There are three outfield positions (left field, center field, right field). Given this, how might the graph be misleading?
O A. The positions or combinations of positions should be chosen so that all the bars are closer together in height.
B. The graph is misleading because the bars are decreasing in height from left to right.
C. The chart seems to show that one position has many more MVPS because three positions are combined into one. They should be separated.
O D. All the information is true, so the graph is not misleading.
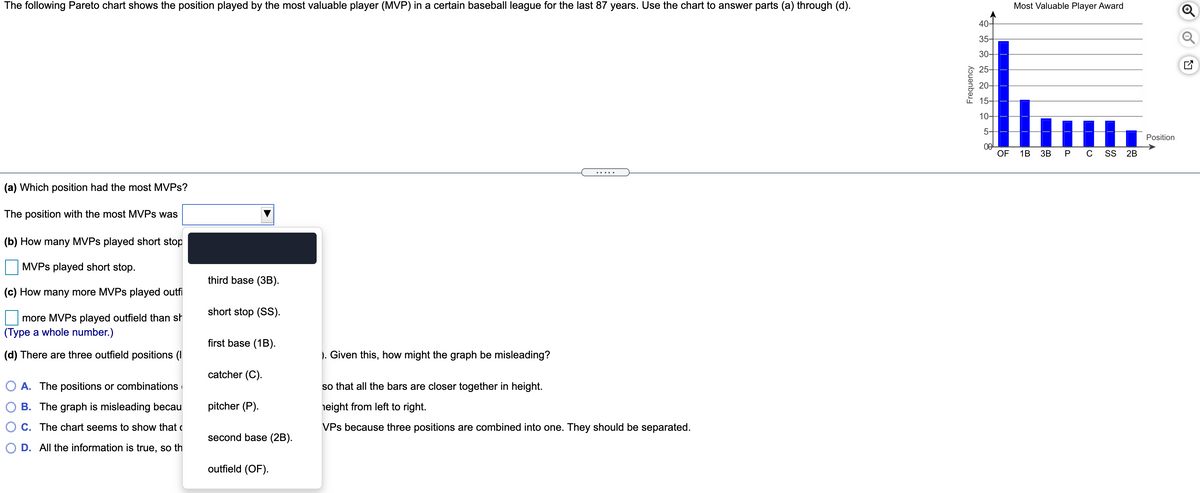
Transcribed Image Text:The following Pareto chart shows the position played by the most valuable player (MVP) in a certain baseball league for the last 87 years. Use the chart to answer parts (a) through (d).
Most Valuable Player Award
40-
35-
30-
25-
20-
15-
10-
5-
Position
OF
1B
3B
Р С
S
2B
.....
(a) Which position had the most MVPS?
The position with the most MVPS was
(b) How many MVPS played short stop
MVPS played short stop.
third base (3B).
(c) How many more MVPS played outfi
short stop (SS).
more MVPS played outfield than sh
(Type a whole number.)
first base (1B).
(d) There are three outfield positions (I
). Given this, how might the graph be misleading?
catcher (C).
O A. The positions or combinations
so that all the bars are closer together in height.
O B. The graph is misleading becau
pitcher (P).
neight from left to right.
O C. The chart seems to show that c
VPs because three positions are combined into one. They should be separated.
second base (2B).
O D. All the information is true, so th
outfield (OF).
Frequency
Expert Solution
This question has been solved!
Explore an expertly crafted, step-by-step solution for a thorough understanding of key concepts.

This is a popular solution!

Trending now
This is a popular solution!

Step by step
Solved in 4 steps with 1 images

Recommended textbooks for you

Elements Of Modern Algebra
Algebra
ISBN:
9781285463230
Author:
Gilbert, Linda, Jimmie
Publisher:
Cengage Learning,

Algebra & Trigonometry with Analytic Geometry
Algebra
ISBN:
9781133382119
Author:
Swokowski
Publisher:
Cengage
Elements Of Modern Algebra
Algebra
ISBN:
9781285463230
Author:
Gilbert, Linda, Jimmie
Publisher:
Cengage Learning,
Algebra & Trigonometry with Analytic Geometry
Algebra
ISBN:
9781133382119
Author:
Swokowski
Publisher:
Cengage