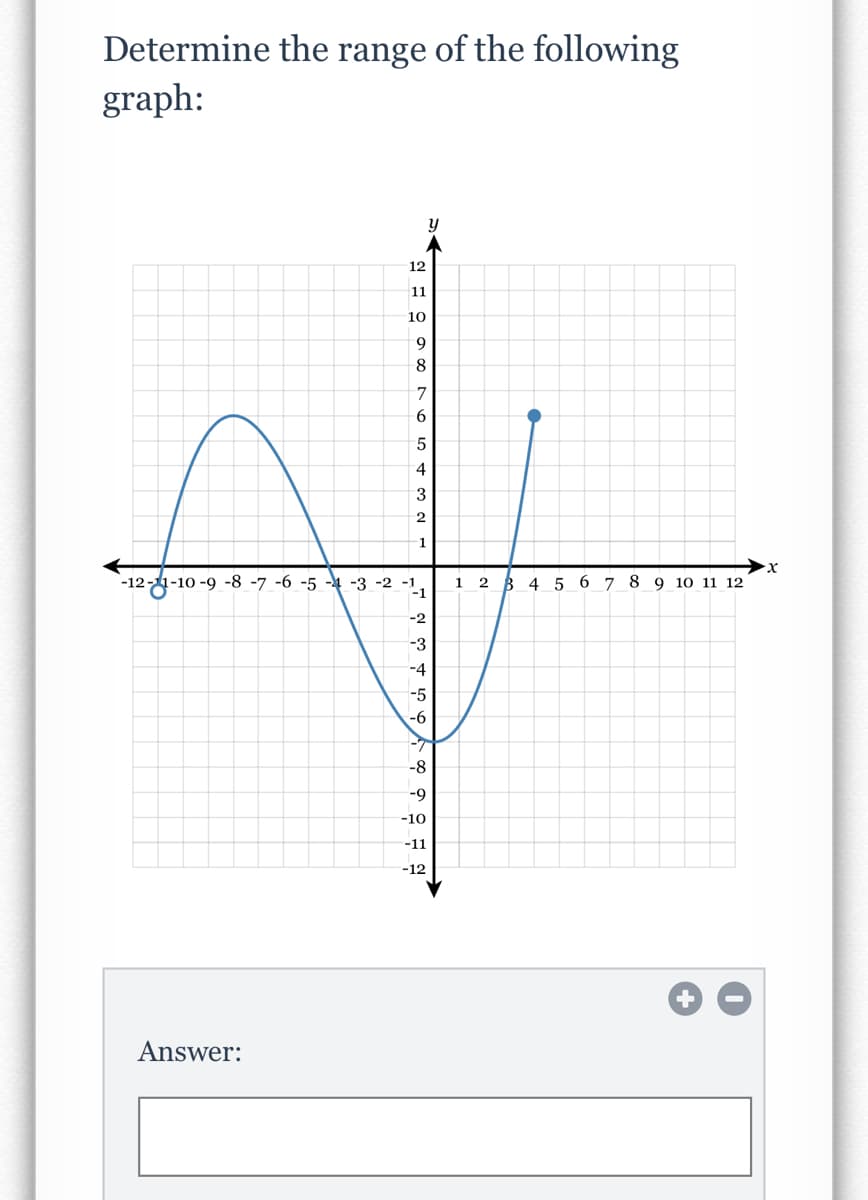
Determine the range of the following graph: 12 11 10 6. 8 7 4 3 -12-1-10 -9 -8 -7 -6 -5 - -3 -2 -1 1 2 345 6 7 8 9 10 11 12 -1 -2 -3 -4 -5 -6 -7 -8 -9 -10 -11 -12 1.


Q: Determine the range of the following graph: 12 11 10 6. 8. 7. 6. 3. 2 -12-11-10 -9 -8 4 -3-2 -1, 1 2…
A: The range is the set of the possible outcome, which shows on y-axis. The verticle extent of curve on…
Q: how do i match the following graphs with the corresponding choice ? step by step please.
A: Given:
Q: Mark the critical points on the following graph. ate,0.4 2+ 1.6 12 0.8 0.4 -3 -2 3 -04 0.8 -12 -1.6…
A: The critical points are the point where function has maximum and minimum. For that need to find…
Q: Plot these points: x y 1 7 5 5 6 8 4 3 7 6 on a graph
A:
Q: Determine the domain of the following graph: 12 11 10 4 -12-11-10 -9 -8 -7 -6 -5 -4 -3 -21. 1 2 3 4…
A: Given is the graph of a function. Definition of domain: The values of x for which the function is…
Q: Determine the domain of the following graph: y 12 11 10 9. 8 4. 3. -12-11-10 -9 -8 -7 -6 -5 -4 -3 -2…
A: Please refer the attached image for complete solution.
Q: Determine the domain of the following graph: 12 11 10 8. 12-11-10-9 -8 7-6 -5 -4 -3 -2 2 3 4 5 6 7-…
A:
Q: Use the graphs below to choose the correct symbol (, =) from each dropdown menu. h(x): g(x): 51 3. 3…
A:
Q: Determine the domain of the following graph: 12 11 10 6. 8. 4 3 -12-11-10 -9 -8 -7 -6 -5 -4 -3 -2 -1…
A:
Q: Determine the domain of the following graph: 12 11 10 7. 6. 4 1 -12-11-10-9-8 -7-6-5-4-3-2 1 2 3 4 5…
A:
Q: Determine the range of the following graph: 12 11 10 9. 8. 7 6. 4 3 -12-11-10 9 -8 -7 -6 -4 -3 -2 -1…
A:
Q: Use the graph below to answer the following questions: 10+ 4 2 8 10 10 -8 -6 -4 -2 -2 4 -4 -6- -8 1…
A: ANSWER
Q: Match each graph with its table. Input Output -2 -2 2- -1 -1 a. Input Output -2 4. -1 2 1 2 2 b. 3 3…
A: Given , We need to match the tables with the graph
Q: Determine the range of the following graph: 12 11 10 6. 7 6. 4 3 -12-11-10 -9 -8 -7 -6 -5 -4 -3 -2…
A:
Q: Determine the domain of the following graph: 12 11 10 8 6. 5 4 3. 2. -12-11-10 -9 -8 -7 -6 -5 -4 -3…
A:
Q: Determine the domain of the following graph: 12 11 10 6. 6. 5 4 3 1. -12-11-10 -9 -8 -7 -6 -5 -4 -3…
A:
Q: how to find domain and range of graph?
A: Before we answer this question let’s first see what exactly domain and range is.
Q: For the graphs, state the domain and range in interval notation. 4. 5. 3+ 2- HHKH -5-4-3-2 i 274 5'e…
A: Domain: (-4,5] Range: [-6,5]
Q: Determine the range of the following graph: 12 11 10 9 8 -1 -12-11-10 -9 8 -7 -6 -5 -4 3 -2 -1. 1 2…
A:
Q: Determine the domain of the following graph: 12 11 10 6. 8. 5 4 3 -12-11-10 -9/-8-7-6 -5 -4 -3 -2…
A: A function is a relation that maps each value in its domain to one, and exactly one value in its…
Q: Based on the following graph, find h(1): -1 4 8. -1 -2 -3
A: Explained below
Q: Determine the range of the given graph. * 6 2 -10 -2 2. 8. 10 PLARSON hp 2.
A: To Determine: Range of given graph
Q: 1) Find the domain and range of the following graphs. (a) (b)
A: Domain of a function is possible x-values or the input values. Range of the function is the possible…
Q: Consider the graph of f. y 4 3 1 1 2 2 3 4 5 6 7 8 9
A:
Q: Describe the end behavior of the graph shown. 10 6. 8. 7. 5. 4 3. -6 3 4. 6. 7. 8. 9 10 -10 -9 -8 -7…
A: The end behavior of a function f describes the behavior of the graph of the function at the…
Q: Determine the range of the following graph: 12 11 10 6. 4 3. -12-11-10-9-8-7-6-5-43 -2 -1, 23 4 5 6…
A:
Q: Determine the range of the following graph: 12 11 10 9. 8 4 3 2 1 -12-11-10 -9 -8 -7 -6 -5 -4 -3 -2…
A: Solution is given as below:
Q: Mark the critical points on the following graph. 36+ 30 24 18 ¥2 -5 -4 -3 -2 -1 3 4 -12 -18- Clear…
A: To mark the critical points from the given graph
Q: Determine the domain of the following graph: 12 11 10 8 7 4 3 2 1 -12-11-10-9 -8 -7 -6 -5 -4 -3…
A: We have to find the domain of the given graph.
Q: Determine the domain of the following graph: 12 11 10 6. 7 -12-11-10 -9 -8 -7 -6 -5 -4 -3 -2 -1 1 2…
A: We are asked to find the domain of the graph
Q: Given the following graph, determine the following: f(-4) (6,5), 14) (-4,2) (6,2) -4 -2 6. -2 9(1…
A: Given query is to find the f(-4) from the graph.
Q: Determine the domain of the following graph: 12 11 10 8. 9. 4 3 1 -12-11-10-9-8-7-6 -5 -4 -3 -2 -1,…
A: To find: The domain of the graph. Concept used: Domain: The set of all input values x-values for…
Q: Determine the range of the following graph: 12 11 10 4 3 1 `-12-11-10 -9 8 -7 -6 -5 -4 3 -2 -1 1 2 3…
A:
Q: Determine the domain of the following graph: 12 11 10 9. 5. 3. 2. -1 -12-11-10 -9 -8 - -6 -4-3-2 -1…
A: We can obtain the domain by finding where the function is defined.
Q: Mark the critical points on the following graph. 22 - 3, 4 36 32 28 24 20 16 12 4- Clear All Draw:…
A:
Q: Determine the domain of the following graph: 12 11 10 9. 8 7. 4. 3 1 -12-11-10 -9-8 -7 -6 -5 -4 -3…
A:
Q: Mark the critical points on the following graph. .2 5,0.2 - 2+ 1.8 1.6 1.4 1.2 0.8- \0.6- 0.4 Clear…
A:
Q: Determine the domain of the following graph: 12 11 10 6. 8 6. 5 4 3 1 `-12-11-10 -9 -8-7 -6 -5 -4 3…
A: given,
Q: is the graph of y = -2/3 x + 4. -6-5-4-3-2-10 1 2 3 456 -1 -2 -3 -4 -5 -6 65 321
A:
Q: Use the graphs to evaluate the expressions below. 6- 6- fx) 5 g(x) 4 4 3. 3+ 2- -1 -1+ 1 2 3 4 21…
A: From the given graphs we find that f(3)=1, g(1)=3, g(2)=1. Now, g(f(a)) means value of g at x=f(a)…
Q: Determine the range of the following graph: 12 11 10 6. 8 4 3 -12-11-10 -9 -8 -7-6 -5 -4 -3 -2 -1, x…
A: Recall: The domain refers to the set of possible input values , the domain of the graph consists…
Q: Determine the range of the following graph: 12 11 10 6. 8. 4 3 1 -12-11-10 -9 -8 -7 6 -5 -4 -3 -2…
A: Range of the graph:- The range of the graph is all possible output values which are shown on y-axis.…
Q: Determine the range of the following graph: 12 11 10 6. 8. 7. 6. 1 -12-11-10 -9 -8 -7 -6 ở -4 -3…
A: Observing from this graph we have
Q: Mark the critical points on the following graph. 18 12 6- 4 5 -5 -4 -3/-2 -1 -12 -18 -24 -30 36 42+…
A: Critical points are the points where fx) is maximum and minimum.
Q: Which of the following describes the graph of h(x) = -2(x+3)+4? 4 h(x) 2 -6 -5 4 -3 -2 2 3 4 5 10 6…
A:
Q: Use the graph below to answer the following questions: 5- 4- 3- -5 -4 -3 -2 4 -1 =1 3 5 -2 -3- -4…
A: 2- means on the left side of x=2 There the graph is going upwards. So f(x) approaches ∞.…
Q: Determine the domain and range of each of the following graphs
A: consider the solution equation domain=(4 ,-4) Range=(-4,4)
Q: Determine the domain of the following graph: 12 11 10 3. 2. -12-11-10-9 -8 -7-6-5 -4 -3 -2 -1 2 3 45…
A: Domain : - Domain of a function means from where to where a function is defined( has finite value)…
Q: Make each graph with its correct equation. 3. -78 -5 -4 -3-2 -1 4. 123456 tut 3-2-1 12345 -2 5. 6.…
A:


Trending now
This is a popular solution!

Step by step
Solved in 2 steps with 1 images


- Suppose the following table was generated from the sample data of 2020 campuses relating the total number of crimes committed to the number of police officers on campus and if the college or university is public. Coefficients Standard Error t Stat P-Value Intercept 580.942968580.942968 20.62950320.629503 28.16078428.160784 0.0000000.000000 Number of Officers −7.426422−7.426422 0.7279040.727904 −10.202475−10.202475 0.0000000.000000 Public (1 if public, 0 otherwise) −67.902296−67.902296 7.4726387.472638 −9.086791−9.086791 0.0000000.000000 Step 1 of 2 : In this regression equation, what is the intercept value for colleges or universities that are private? Enter your answer in the space provided. Do not round your answer.Suppose the following table was generated from the sample data of 2020 campuses relating the total number of crimes committed to the number of police officers on campus and if the college or university is public. Coefficients Standard Error t Stat P-Value Intercept 602.691839602.691839 18.76336018.763360 32.12067832.120678 0.0000000.000000 Number of Officers −8.400063−8.400063 0.6195730.619573 −13.557826−13.557826 0.0000000.000000 Public (1 if public, 0 otherwise) −46.038506−46.038506 7.4066897.406689 −6.215801−6.215801 0.0000090.000009 Step 2 of 2 : In this regression equation, what is the intercept value for colleges or universities that are public? Enter your answer in the space provided. Do not round your answerSuppose you randomly select a sample of 16 observations from a population with �=11 attached in ss below thanks for help agoajgr r
- THE FOLLOWING ARE THE SCORES OF 7 BSPT 1A2-2 STUDENTS IN THE 30-ITEM QUIZ IN MATM 111: 28 20 26 25 27 30 25 WHICH IS THE MEDIAN? CHOICES: 28262527If the p value from the output of SPSS is .02, thenSuppose the following table was generated from the sample data of 2020 campuses relating the total number of crimes committed to the number of police officers on campus and if the college or university is private. Coefficients Standard Error t Stat P-Value Intercept 616.744780616.744780 19.49079719.490797 31.64287131.642871 0.0000000.000000 Number of Officers −8.695195−8.695195 0.6457940.645794 −13.464348−13.464348 0.0000000.000000 Private (1 if private, 0 otherwise) −61.653714−61.653714 7.3458937.345893 −8.392950−8.392950 0.0000000.000000 Step 1 of 2: In this regression equation, what is the intercept value for colleges or universities that are public? Enter your answer in the space provided. Do not round your answer. Step 2 of 2: In this regression equation, what is the intercept value for colleges or universities that are private? Enter your answer in the space provided. Do not round your answer.
- Recent surveys have shown a decline in the percentage of U.S. households withcable TV. In one city, a simple random sample of 468 households had 117households reporting they had cable TV, and 351 households reporting they didnot.(a) Show the “plug-in” box to represent our best guess for the relative frequency ofpeople with and without cable. (Let 1 correspond to with cable and 0 without).(b) The percentage of households in the city with cable TV is estimated to be___________%, and this estimate is likely to be off by about ___________% or so.(c) A 90%-confidence interval for the percentage of households in the city withcable TV goes from ___________% to ___________%.A consulting firm was hired to conduct a survey on people living in New York City. The survey was completed monthly for six months by 445 randomly-selected people in different boroughs. You may assume that these respondents represent a simple random sample of all potential respondents within the community, and that the population is large enough that application of the finite population correction would not make an appreciable difference in the results. Item A in the description of the data collection instrument lists variables 1 through 5, which represent the respondent’s general attitude toward each of the five boroughs. Each of these variables has numerically equal distances between the possible responses, and for purposes of analysis they may be considered to be of the interval scale of measurement. Determine the point estimate, and then construct the 95% confidence interval for μ1= the average attitude toward Manhattan. Repeat part (a) for μ2 through μ5, the average attitudes…The table below summarizes data from a survey of a sample of women. Using a 0.01significance level, and assuming that the sample sizes of 800 men and 300 women are predetermined, test the claim that the proportions of agree/disagree responses are the same for subjects interviewed by men and the subjects interviewed by women. Does it appear that the gender of the interviewer affected the responses of women? Gender of Interviewer Man Woman Women who agree 498 247 Women who disagree 302 53 Compute the test statistic, rounding to three decimal places. Find the critical value(s). (Round to three decimal places) What is the conclusion based on the hypothesis test?
- The random digit table is applied here for part a)Researchers conducted a study to find out if there is a difference in the use of online-learning by different age groups. Randomly selected participants were divided into two age groups. In the 16 to 29-year-old group, 7% of the 628 surveyed use online-learning, while 11% of the 2,309 participants 30 years old and older use online learning. (Set 1 for 16-29 year old group; Set 2 for 30 years old and older). Find the p-value of 2-prop-z-test.Suppose the following table was generated from a sample of 2020 CEOs relating annual salary to years of experience and the industry in which they are employed. Indicator (dummy) variables were created for each industry (1 if the CEO works in that industry, 0 otherwise). The Manufacturing industry is considered the base-level industry. Coefficients Standard Error t Stat P-Value Intercept 136089.391879136089.391879 4059.2370454059.237045 33.52585533.525855 0.0000000.000000 Experience 3522.7465883522.746588 220.558598220.558598 15.97193015.971930 0.0000000.000000 Financial 8063.7816448063.781644 4891.6297224891.629722 1.6484861.648486 0.1200340.120034 Service −12825.673026−12825.673026 4997.6845794997.684579 −2.566323−2.566323 0.0214910.021491 Health Care 16309.98615216309.986152 5281.8143395281.814339 3.0879513.087951 0.0075000.007500 According to the results, if a CEO in the Manufacturing industry and a CEO in the Health Care industry both have 33 years of experience,…