b) Refer to Figure 1. The time period in Figure I c) Refer to Figure 1. Find the firm's ATC when profit is maximized Atc = d) Refer to Figure 1. Find the firm's AVC when profit is maximized e) Refer to Figure 1. Find the value of Average Fixed Cost (AFC) when 17 units are produc f) Refer to Figure 1. Find Total Fixed Cost (TFC) 3) Refer to Figure 1. Find the profit maximizing quantity of the perfectly competitive f a) Refer to Figure 1. Find the firm's maximum profit (or loss)
b) Refer to Figure 1. The time period in Figure I c) Refer to Figure 1. Find the firm's ATC when profit is maximized Atc = d) Refer to Figure 1. Find the firm's AVC when profit is maximized e) Refer to Figure 1. Find the value of Average Fixed Cost (AFC) when 17 units are produc f) Refer to Figure 1. Find Total Fixed Cost (TFC) 3) Refer to Figure 1. Find the profit maximizing quantity of the perfectly competitive f a) Refer to Figure 1. Find the firm's maximum profit (or loss)

Managerial Economics: Applications, Strategies and Tactics (MindTap Course List)
14th Edition
ISBN:9781305506381
Author:James R. McGuigan, R. Charles Moyer, Frederick H.deB. Harris
Publisher:James R. McGuigan, R. Charles Moyer, Frederick H.deB. Harris
Chapter3: Demand Analysis
Section: Chapter Questions
Problem 1E: The Potomac Range Corporation manufactures a line of microwave ovens costing $500 each. Its sales...

Related questions
Question
Answer all parts... Only will consider
Transcribed Image Text:MC
ATC
AVC
23
22
16
MR
12
11
14
17 19
Quantity (unita)
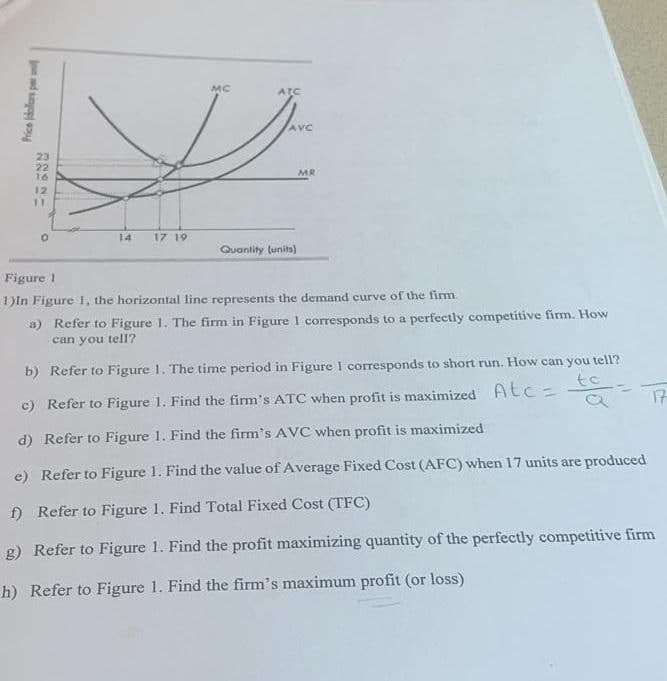
Figure 1
1)In Figure 1, the horizontal line represents the demand curve of the firm.
a) Refer to Figure 1. The firm in Figure 1 corresponds to a perfectly competitive firm. How
can you tell?
b) Refer to Figure 1. The time period in Figure I corresponds to short run. How can you tell?
to
17
c) Refer to Figure 1. Find the firm's ATC when profit is maximized Atc=
d) Refer to Figure 1. Find the firm's AVC when profit is maximized
e) Refer to Figure 1. Find the value of Average Fixed Cost (AFC) when 17 units are produced
f) Refer to Figure 1. Find Total Fixed Cost (TFC)
g) Refer to Figure 1. Find the profit maximizing quantity of the perfectly competitive firm
h) Refer to Figure 1. Find the firm's maximum profit (or loss)
d oop
Expert Solution
This question has been solved!
Explore an expertly crafted, step-by-step solution for a thorough understanding of key concepts.

Step by step
Solved in 2 steps

Knowledge Booster


Learn more about
Need a deep-dive on the concept behind this application? Look no further. Learn more about this topic, economics and related others by exploring similar questions and additional content below.Recommended textbooks for you
Managerial Economics: Applications, Strategies an…
Economics
ISBN:
9781305506381
Author:
James R. McGuigan, R. Charles Moyer, Frederick H.deB. Harris
Publisher:
Cengage Learning
Managerial Economics: Applications, Strategies an…
Economics
ISBN:
9781305506381
Author:
James R. McGuigan, R. Charles Moyer, Frederick H.deB. Harris
Publisher:
Cengage Learning