Looking at the data for Pearson's Correlation, which one has the strongest and which one is the lowest?
Looking at the data for Pearson's Correlation, which one has the strongest and which one is the lowest?

MATLAB: An Introduction with Applications
6th Edition
ISBN:9781119256830
Author:Amos Gilat
Publisher:Amos Gilat
Chapter1: Starting With Matlab
Section: Chapter Questions
Problem 1P

Related questions
Question
Looking at the data for Pearson's
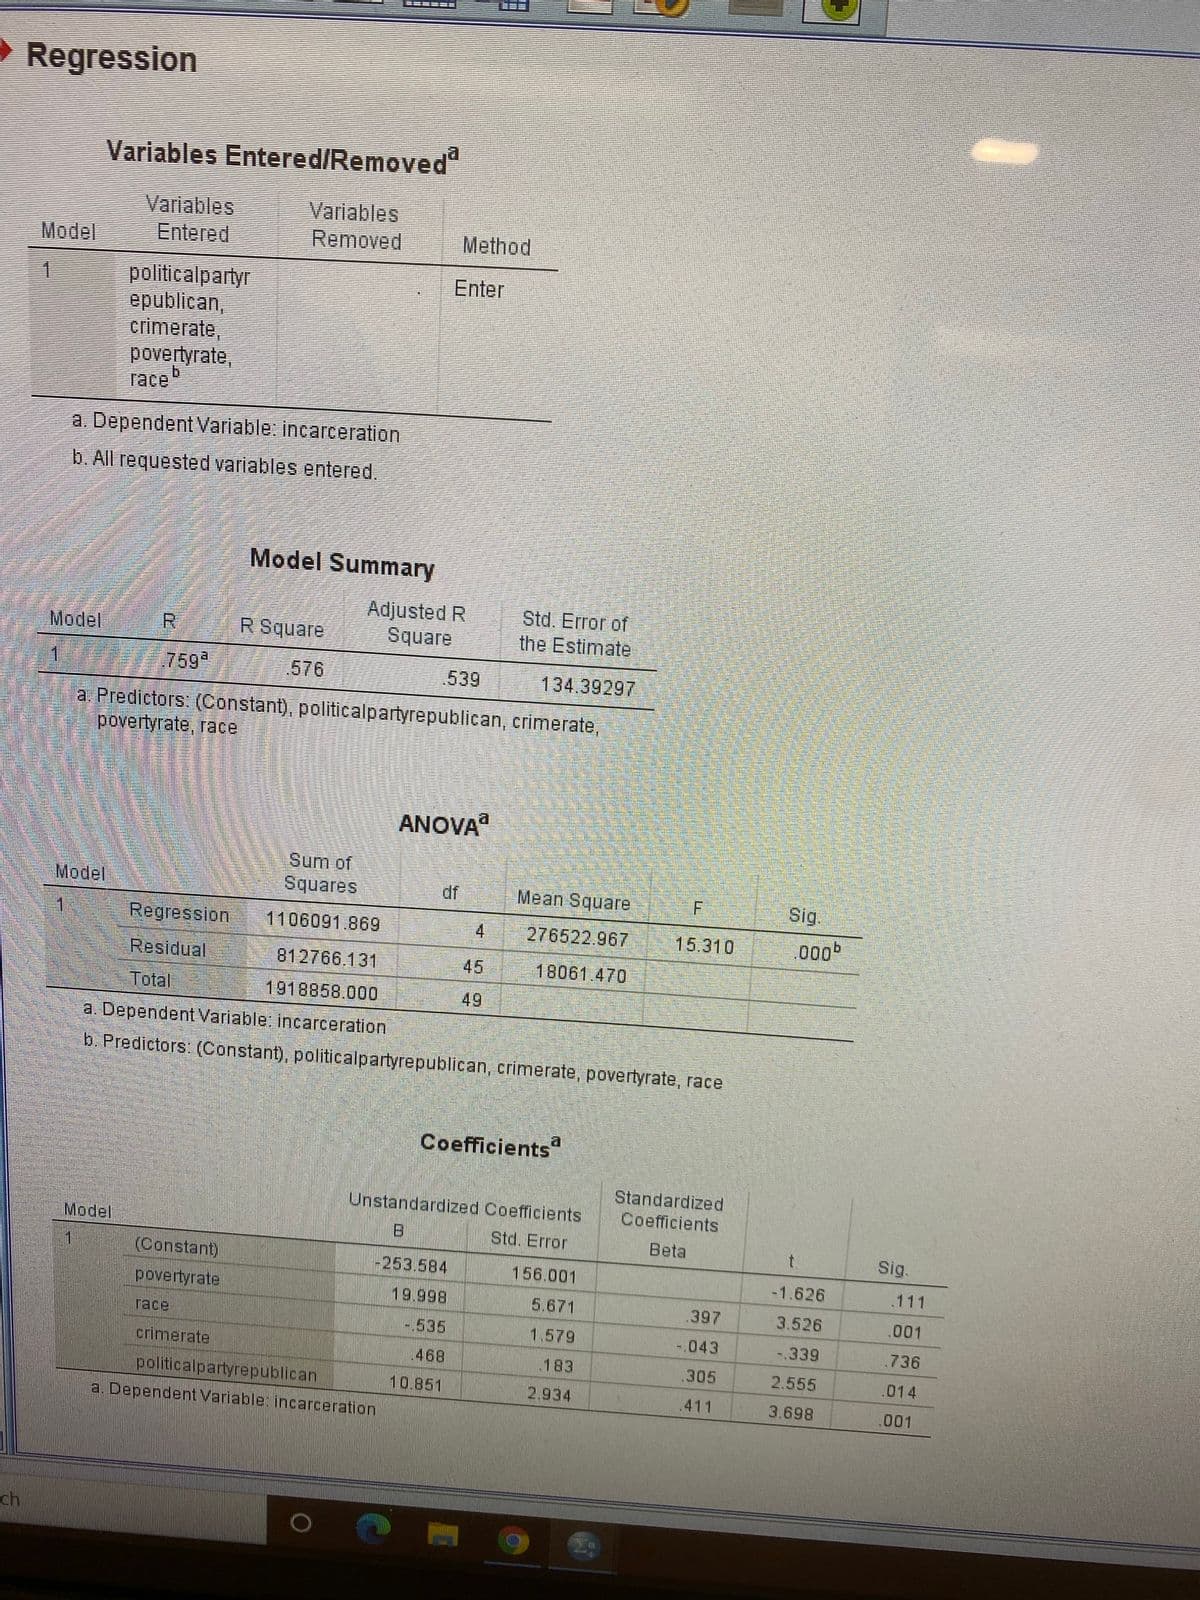
Transcribed Image Text:- Regression
Variables Entered/Removeda
Variables
Entered
Variables
Removed
Model
Method
politicalpartyr
epublican,
crimerate,
povertyrate,
race
Enter
a Dependent Variable: incarceration
b. All requested variables entered.
Model Summary
Adjusted R
Square
Std. Error of
Model
R.
R Square
the Estimate
759
576
539
134.39297
a. Predictors (Constant), politicalpartyrepublican, crimerate,
povertyrate, race
ANOVA
Sum of
Model
Squares
df
Mean Square
Sig.
Regression
1106091.869
276522.967
4
15.310
000
Residual
812766.131
45
18061.470
Total
1918858.000
49
a. Dependent Variable: incarceration
b. Predictors: (Constant), politicalpartyrepublican, crimerate, povertyrate, race
Coefficients
Standardized
Unstandardized Coefficients
Coefficients
Model
Std. Error
Beta
t.
Sig.
1
(Constant)
-253.584
156.001
-1.626
.111
povertyrate
8669
-.535
5.671
.397
3.526
.001
race
1.579
-.043
-.339
.736
crimerate
.468
.183
.305
2.555
.014
politicalpartyrepublican
10.851
2.934
a. Dependent Variable: incarceration
.411
3.698
.001
ch
![/VARIABLES=incarceration povertyrate race politicalpartyrepublican crimerat
ĐISON TIVLOMI=LNIHd/
Correlations
[DataSet0]
Correlations
politicalpartyr
epublican
incarceration
povertyrate
Incarceration'
Pearson Corelation
603
-152
1.
000
50
Sig (2-tailed)
000
N.
Pearson Corelation
09
povertyrate
-311
444
E09
1.
Sig (2-tailed)
000
09
.394
Pearson Correlation
-152
-311
1.
Sig. (2-tailed)
067
000*
09
politicalpartyrepublican
Pearson Correlation
1.
Sig. (2-tailed)
001
337
005
crimerate
Pearson Correlation
444
-.030
066
985
1.
Sig. (2-tailed)
001
836
000
000
Correlation is significant at the 0.01 level (2-tailed).
* Correlation is significant at the 0.05 level (2-tailed).
REGRESSION
ASIMISIT ONISSIN/
/STATISTICS COEFE OUIS R ANOVA
/NOORIGIN
VDEPENDENT incarceration
/METHOD=ENTER povertyrate race crimerate politicalpartyrepublican.
Regression
Variables Entered/Removed"](/v2/_next/image?url=https%3A%2F%2Fcontent.bartleby.com%2Fqna-images%2Fquestion%2F985faa7b-eb2f-4c1e-b4cd-00f056084517%2F552016fa-eace-4e54-848b-b8640d90e658%2Fne8b2xd.jpeg&w=3840&q=75)
Transcribed Image Text:/VARIABLES=incarceration povertyrate race politicalpartyrepublican crimerat
ĐISON TIVLOMI=LNIHd/
Correlations
[DataSet0]
Correlations
politicalpartyr
epublican
incarceration
povertyrate
Incarceration'
Pearson Corelation
603
-152
1.
000
50
Sig (2-tailed)
000
N.
Pearson Corelation
09
povertyrate
-311
444
E09
1.
Sig (2-tailed)
000
09
.394
Pearson Correlation
-152
-311
1.
Sig. (2-tailed)
067
000*
09
politicalpartyrepublican
Pearson Correlation
1.
Sig. (2-tailed)
001
337
005
crimerate
Pearson Correlation
444
-.030
066
985
1.
Sig. (2-tailed)
001
836
000
000
Correlation is significant at the 0.01 level (2-tailed).
* Correlation is significant at the 0.05 level (2-tailed).
REGRESSION
ASIMISIT ONISSIN/
/STATISTICS COEFE OUIS R ANOVA
/NOORIGIN
VDEPENDENT incarceration
/METHOD=ENTER povertyrate race crimerate politicalpartyrepublican.
Regression
Variables Entered/Removed"
Expert Solution
This question has been solved!
Explore an expertly crafted, step-by-step solution for a thorough understanding of key concepts.

This is a popular solution!

Trending now
This is a popular solution!

Step by step
Solved in 2 steps with 2 images

Recommended textbooks for you
MATLAB: An Introduction with Applications
Statistics
ISBN:
9781119256830
Author:
Amos Gilat
Publisher:
John Wiley & Sons Inc

Probability and Statistics for Engineering and th…
Statistics
ISBN:
9781305251809
Author:
Jay L. Devore
Publisher:
Cengage Learning

Statistics for The Behavioral Sciences (MindTap C…
Statistics
ISBN:
9781305504912
Author:
Frederick J Gravetter, Larry B. Wallnau
Publisher:
Cengage Learning
MATLAB: An Introduction with Applications
Statistics
ISBN:
9781119256830
Author:
Amos Gilat
Publisher:
John Wiley & Sons Inc
Probability and Statistics for Engineering and th…
Statistics
ISBN:
9781305251809
Author:
Jay L. Devore
Publisher:
Cengage Learning
Statistics for The Behavioral Sciences (MindTap C…
Statistics
ISBN:
9781305504912
Author:
Frederick J Gravetter, Larry B. Wallnau
Publisher:
Cengage Learning

Elementary Statistics: Picturing the World (7th E…
Statistics
ISBN:
9780134683416
Author:
Ron Larson, Betsy Farber
Publisher:
PEARSON

The Basic Practice of Statistics
Statistics
ISBN:
9781319042578
Author:
David S. Moore, William I. Notz, Michael A. Fligner
Publisher:
W. H. Freeman

Introduction to the Practice of Statistics
Statistics
ISBN:
9781319013387
Author:
David S. Moore, George P. McCabe, Bruce A. Craig
Publisher:
W. H. Freeman