b. An excel analysis was applied to data collected from a random sample of 100 people in order to preform regression analysis for the prediction of variable y using the values of 3 predictors: X1, X2, X3. The following output was obtained (omitting some entries). Regression Statistics Multiple R R Square Adjusted R Square Standard Error Observations ANOVA Regression Residual Total X1 X2 X3 Intercept df 2.229 100 Coefficients -0.643 -0.111 0.395 0.073 SS 141.77 476.98 SE 3.400 0.084 0.082 0.047 MS F t Stat P-value -0.189 0.850485 Lower 95% -7.392 -0.278 0.233 -0.021 Upper 95% 6.107 0.056 0.558 0.166 (Note: since the sample is large, in sections where the t distribution is needed, you can use the Z one) i. Use a significance level of 1% to test if the entire regression model is significant. ii. Test which of the predictors is significant using a significance level of 1%.
b. An excel analysis was applied to data collected from a random sample of 100 people in order to preform regression analysis for the prediction of variable y using the values of 3 predictors: X1, X2, X3. The following output was obtained (omitting some entries). Regression Statistics Multiple R R Square Adjusted R Square Standard Error Observations ANOVA Regression Residual Total X1 X2 X3 Intercept df 2.229 100 Coefficients -0.643 -0.111 0.395 0.073 SS 141.77 476.98 SE 3.400 0.084 0.082 0.047 MS F t Stat P-value -0.189 0.850485 Lower 95% -7.392 -0.278 0.233 -0.021 Upper 95% 6.107 0.056 0.558 0.166 (Note: since the sample is large, in sections where the t distribution is needed, you can use the Z one) i. Use a significance level of 1% to test if the entire regression model is significant. ii. Test which of the predictors is significant using a significance level of 1%.

Holt Mcdougal Larson Pre-algebra: Student Edition 2012
1st Edition
ISBN:9780547587776
Author:HOLT MCDOUGAL
Publisher:HOLT MCDOUGAL
Chapter11: Data Analysis And Probability
Section: Chapter Questions
Problem 8CR

Related questions
Question
100%
Solve Solve (b part i and ii) only in 30 min and get a thumb up i need perfect soloution plz..
And show neat and clean handwriting plz
Transcribed Image Text:(there is no connection between the different sections)
Question 3
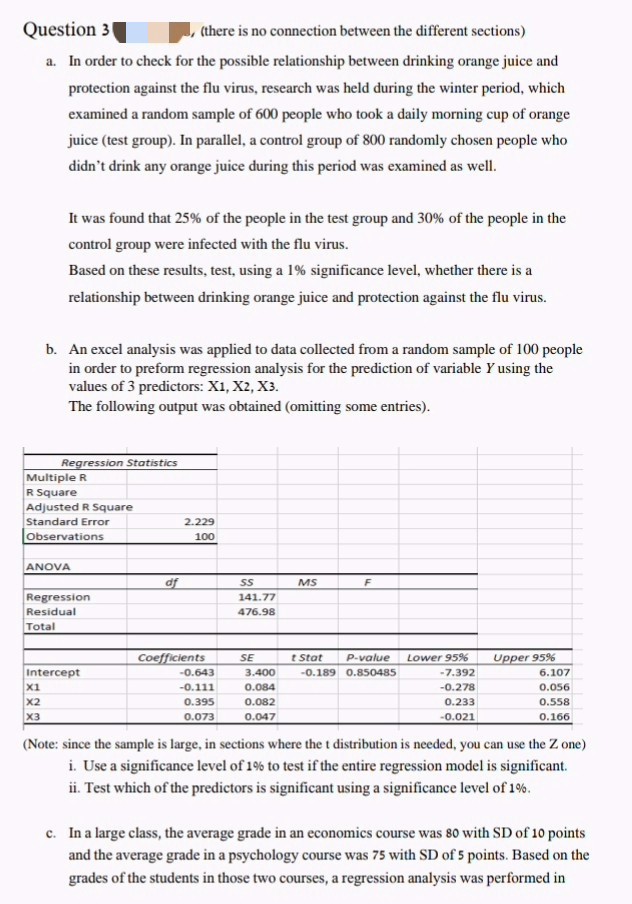
a. In order to check for the possible relationship between drinking orange juice and
protection against the flu virus, research was held during the winter period, which
examined a random sample of 600 people who took a daily morning cup of orange
juice (test group). In parallel, a control group of 800 randomly chosen people who
didn't drink any orange juice during this period was examined as well.
It was found that 25% of the people in the test group and 30% of the people in the
control group were infected with the flu virus.
Based on these results, test, using a 1% significance level, whether there is a
relationship between drinking orange juice and protection against the flu virus.
b. An excel analysis was applied to data collected from a random sample of 100 people
in order to preform regression analysis for the prediction of variable y using the
values of 3 predictors: X1, X2, X3.
The following output was obtained (omitting some entries).
Regression Statistics
Multiple R
R Square
Adjusted R Square
Standard Error
Observations
ANOVA
X1
X2
X3
Regression
Residual
Total
Intercept
df
2.229
100
Coefficients
-0.643
-0.111
0.395
0.073
SS
141.77
476.98
SE
3.400
0.084
0.082
0.047
MS
F
t Stat
P-value Lower 95%
-0.189 0.850485
-7.392
-0.278
0.233
-0.021
Upper 95%
6.107
0.056
0.558
0.166
(Note: since the sample is large, in sections where the t distribution is needed, you can use the Zone)
i. Use a significance level of 1% to test if the entire regression model is significant.
ii. Test which of the predictors is significant using a significance level of 1%.
c. In a large class, the average grade in an economics course was 80 with SD of 10 points
and the average grade in a psychology course was 75 with SD of 5 points. Based on the
grades of the students in those two courses, a regression analysis was performed in
Expert Solution
This question has been solved!
Explore an expertly crafted, step-by-step solution for a thorough understanding of key concepts.

Step by step
Solved in 8 steps

Recommended textbooks for you
Holt Mcdougal Larson Pre-algebra: Student Edition…
Algebra
ISBN:
9780547587776
Author:
HOLT MCDOUGAL
Publisher:
HOLT MCDOUGAL

Glencoe Algebra 1, Student Edition, 9780079039897…
Algebra
ISBN:
9780079039897
Author:
Carter
Publisher:
McGraw Hill

College Algebra (MindTap Course List)
Algebra
ISBN:
9781305652231
Author:
R. David Gustafson, Jeff Hughes
Publisher:
Cengage Learning
Holt Mcdougal Larson Pre-algebra: Student Edition…
Algebra
ISBN:
9780547587776
Author:
HOLT MCDOUGAL
Publisher:
HOLT MCDOUGAL
Glencoe Algebra 1, Student Edition, 9780079039897…
Algebra
ISBN:
9780079039897
Author:
Carter
Publisher:
McGraw Hill
College Algebra (MindTap Course List)
Algebra
ISBN:
9781305652231
Author:
R. David Gustafson, Jeff Hughes
Publisher:
Cengage Learning
