b. Compare the results from part (a) to this 95% confidence interval for the percentage 8f 8rdels uata a. Construct a 95% confidence interval Express the percentages in decimal form.
b. Compare the results from part (a) to this 95% confidence interval for the percentage 8f 8rdels uata a. Construct a 95% confidence interval Express the percentages in decimal form.

Glencoe Algebra 1, Student Edition, 9780079039897, 0079039898, 2018
18th Edition
ISBN:9780079039897
Author:Carter
Publisher:Carter
Chapter4: Equations Of Linear Functions
Section: Chapter Questions
Problem 8SGR

Related questions
Question
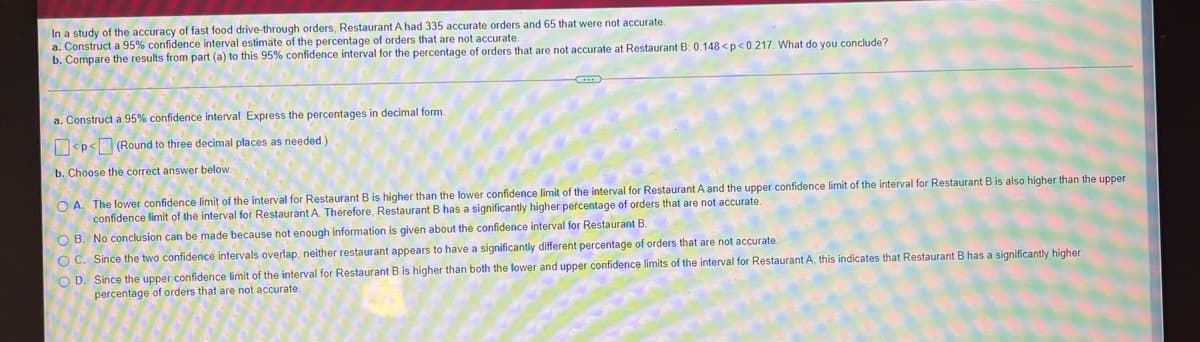
Transcribed Image Text:In a study of the accuracy of fast food drive-through orders, Restaurant A had 335 accurate orders and 65 that were not accurate
a. Construct a 95% confidence interval estimate of the percentage of orders that are not accurate.
b. Compare the results from part (a) to this 95% confidence interval for the percentage of orders that are not accurate at Restaurant B: 0.148 <p<0217. What do you conclude?
a. Construct a 95% confidence interval Express the percentages in decimal form.
<p<(Round to three decimal places as needed)
b. Choose the correct answer below.
O A. The lower confidence limit of the interval for Restaurant B is higher than the lower confidence limit of the interval for Restaurant A and the upper confidence limit of the interval for Restaurant B is also higher than the upper
confidence limit of the interval for Restaurant A. Therefore, Restaurant B has a significantly higher percentage of orders that are not accurate.
O B. No conclusion can be made because not enough information is given about the confidence interval for Restaurant B.
O C. Since the two confidence intervals overlap, neither restaurant appears to have a significantly different percentage of orders that are not accurate
O D. Since the upper confidence limit of the interval for Restaurant B is higher than both the lower and upper confidence limits of the interval for Restaurant A, this indicates that Restaurant B has a significantly higher
percentage of orders that are not accurate.
Expert Solution
This question has been solved!
Explore an expertly crafted, step-by-step solution for a thorough understanding of key concepts.

This is a popular solution!

Trending now
This is a popular solution!

Step by step
Solved in 3 steps with 1 images

Recommended textbooks for you
Glencoe Algebra 1, Student Edition, 9780079039897…
Algebra
ISBN:
9780079039897
Author:
Carter
Publisher:
McGraw Hill

College Algebra (MindTap Course List)
Algebra
ISBN:
9781305652231
Author:
R. David Gustafson, Jeff Hughes
Publisher:
Cengage Learning
Glencoe Algebra 1, Student Edition, 9780079039897…
Algebra
ISBN:
9780079039897
Author:
Carter
Publisher:
McGraw Hill
College Algebra (MindTap Course List)
Algebra
ISBN:
9781305652231
Author:
R. David Gustafson, Jeff Hughes
Publisher:
Cengage Learning