b. Due to the increase in price, consumer surplus O rises by less than $50. O rises by more than $50. falls by less than $50. O falls by more than $50.
b. Due to the increase in price, consumer surplus O rises by less than $50. O rises by more than $50. falls by less than $50. O falls by more than $50.

Microeconomics A Contemporary Intro
10th Edition
ISBN:9781285635101
Author:MCEACHERN
Publisher:MCEACHERN
Chapter5: Elasticity Of Demand And Supply
Section: Chapter Questions
Problem 15PAE

Related questions
Question
Please help
Transcribed Image Text:b. Due to the increase in price, consumer surplus
O rises by less than $50.
O rises by more than $50.
O falls by less than $50.
O falls by more than $50.
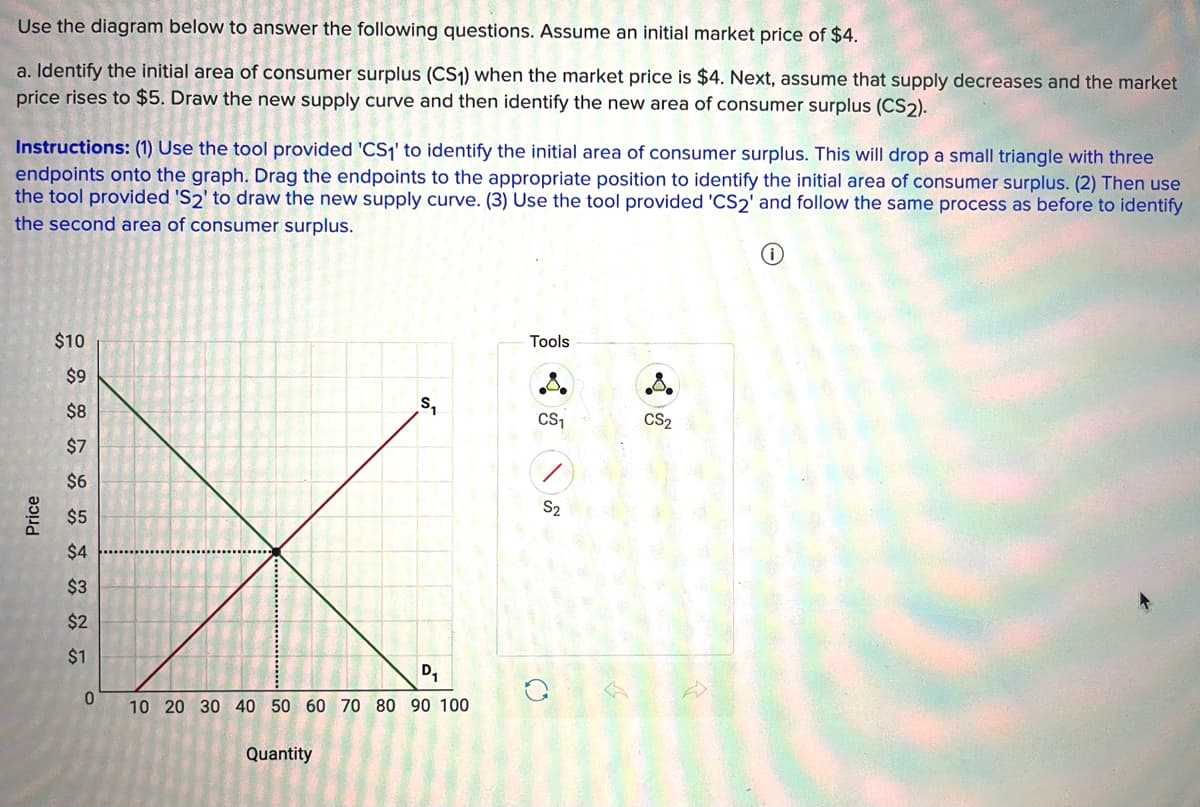
Transcribed Image Text:Use the diagram below to answer the following questions. Assume an initial market price of $4.
a. Identify the initial area of consumer surplus (CS1) when the market price is $4. Next, assume that supply decreases and the market
price rises to $5. Draw the new supply curve and then identify the new area of consumer surplus (CS2).
Instructions: (1) Use the tool provided 'CS1' to identify the initial area of consumer surplus. This will drop a small triangle with three
endpoints onto the graph. Drag the endpoints to the appropriate position to identify the initial area of consumer surplus. (2) Then use
the tool provided 'S2' to draw the new supply curve. (3) Use the tool provided 'CS2' and follow the same process as before to identify
the second area of consumer surplus.
$10
Tools
$9
$8
CS,
CS2
$7
$6
S2
$5
$4
$3
$2
$1
D,
10 20 30 40 50 60 70 80 90 100
Quantity
Price
Expert Solution
This question has been solved!
Explore an expertly crafted, step-by-step solution for a thorough understanding of key concepts.

This is a popular solution!

Trending now
This is a popular solution!

Step by step
Solved in 2 steps with 1 images

Knowledge Booster


Learn more about
Need a deep-dive on the concept behind this application? Look no further. Learn more about this topic, economics and related others by exploring similar questions and additional content below.Recommended textbooks for you


Exploring Economics
Economics
ISBN:
9781544336329
Author:
Robert L. Sexton
Publisher:
SAGE Publications, Inc
