b. The equilibrium price is $ and the equilibrium quantity is ]jackets. c. Due to an increase in the number of producers, the annual quantity supplied in this market increases by 6,000 jackets at every price. The new equilibrium price is $ and the new equilibrium quantity is jackets.
b. The equilibrium price is $ and the equilibrium quantity is ]jackets. c. Due to an increase in the number of producers, the annual quantity supplied in this market increases by 6,000 jackets at every price. The new equilibrium price is $ and the new equilibrium quantity is jackets.

Chapter4: Supply And Demand: An Initial Look
Section: Chapter Questions
Problem 5TY

Related questions
Question
![150
100
E
50
0.
2
4
8.
10 12 14 16 18
Quantity (thousands of jackets per year)
b. The equilibrium price is $
|and the equilibrium quantity is
]jackets.
c. Due to an increase in the number of producers, the annual quantity supplied in this market increases by 6,000 jackets at every
price.
The new equilibrium price is $
and the new equilibrium quantity is
|jackets.
d. Draw the new market supply curve (S1) and indicate the new equilibrium on the graph above. Plot only the 2 endpoints to draw the curve and
1 point to indicate the new equilibrium in the graph above.
e. Due to the change in supply conditions, sellers' total revenue will change. When compared with the initial equilibrium price and
quantity, sellers' total revenue (Click to select) from $
(Click to select) v direction(s), demand is (Click to select) in this price range.
million to $
million. Because price and total revenue move in the
< Prev
3 of 12
Next >
Price ($](/v2/_next/image?url=https%3A%2F%2Fcontent.bartleby.com%2Fqna-images%2Fquestion%2Fc9aa8cb4-27ca-4c47-83ba-e65b51347a24%2F3cfbfd8a-3e51-4de2-8874-c696792404cf%2Fba9j67s_processed.jpeg&w=3840&q=75)
Transcribed Image Text:150
100
E
50
0.
2
4
8.
10 12 14 16 18
Quantity (thousands of jackets per year)
b. The equilibrium price is $
|and the equilibrium quantity is
]jackets.
c. Due to an increase in the number of producers, the annual quantity supplied in this market increases by 6,000 jackets at every
price.
The new equilibrium price is $
and the new equilibrium quantity is
|jackets.
d. Draw the new market supply curve (S1) and indicate the new equilibrium on the graph above. Plot only the 2 endpoints to draw the curve and
1 point to indicate the new equilibrium in the graph above.
e. Due to the change in supply conditions, sellers' total revenue will change. When compared with the initial equilibrium price and
quantity, sellers' total revenue (Click to select) from $
(Click to select) v direction(s), demand is (Click to select) in this price range.
million to $
million. Because price and total revenue move in the
< Prev
3 of 12
Next >
Price ($
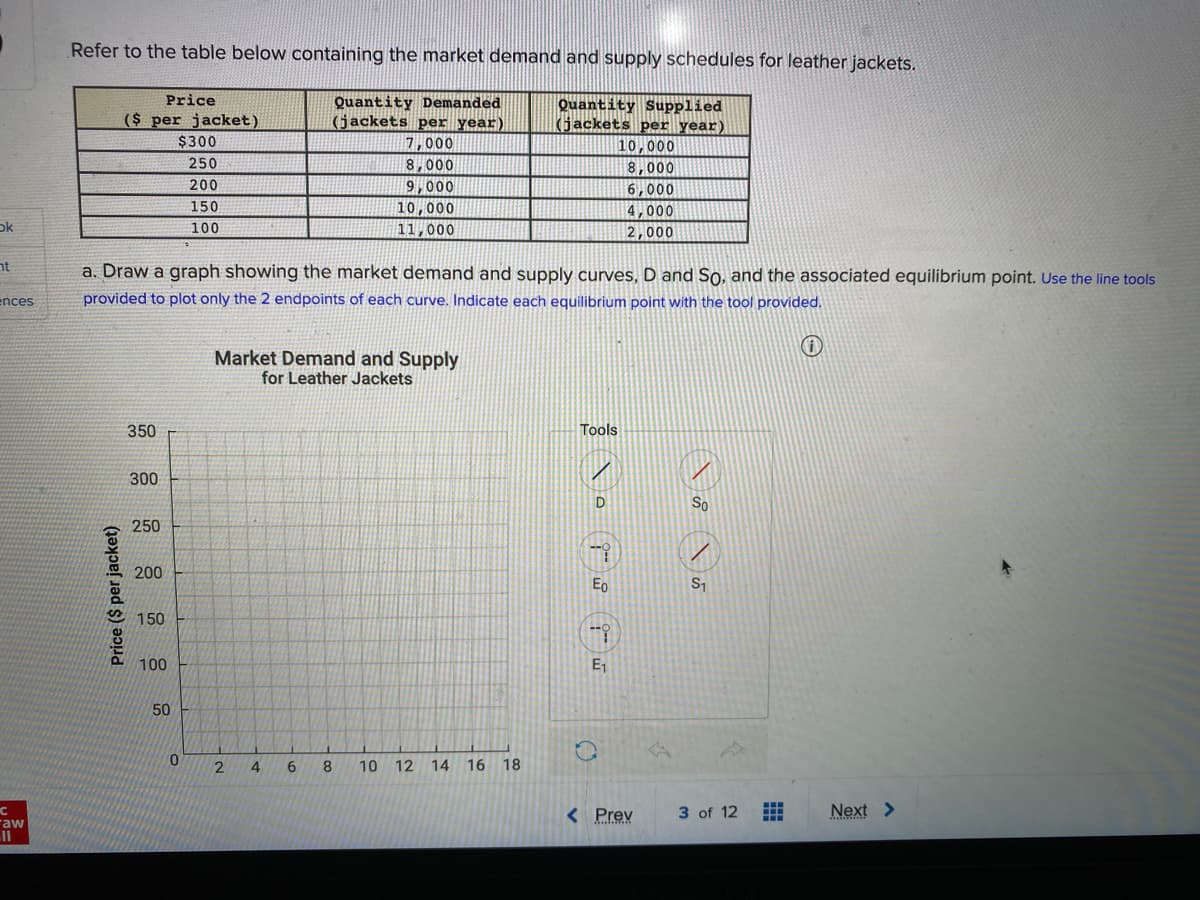
Transcribed Image Text:Refer to the table below containing the market demand and supply schedules for leather jackets.
Price
($ per jacket)
$300
Quantity Demanded
(jackets per year)
Quantity Supplied
(jackets per year)
7,000
10,000
250
8,000
8,000
200
9,000
10,000
11,000
6,000
4,000
150
ok
100
2,000
nt
a. Draw a graph showing the market demand and supply curves, D and So, and the associated equilibrium point. Use the line tools
ences
provided to plot only the 2 endpoints of each curve. Indicate each equilibrium point with the tool provided.
Market Demand and Supply
for Leather Jackets
350
Tools
300
So
250
200
Eo
S1
150
100
E1
50
4
6.
8.
10 12 14 16 18
< Prev
3 of 12
Next >
Faw
Price ($ per jacket)
Expert Solution
This question has been solved!
Explore an expertly crafted, step-by-step solution for a thorough understanding of key concepts.

This is a popular solution!

Trending now
This is a popular solution!

Step by step
Solved in 4 steps with 2 images

Knowledge Booster


Learn more about
Need a deep-dive on the concept behind this application? Look no further. Learn more about this topic, economics and related others by exploring similar questions and additional content below.Recommended textbooks for you

Exploring Economics
Economics
ISBN:
9781544336329
Author:
Robert L. Sexton
Publisher:
SAGE Publications, Inc

Exploring Economics
Economics
ISBN:
9781544336329
Author:
Robert L. Sexton
Publisher:
SAGE Publications, Inc

Economics (MindTap Course List)
Economics
ISBN:
9781337617383
Author:
Roger A. Arnold
Publisher:
Cengage Learning


Managerial Economics: A Problem Solving Approach
Economics
ISBN:
9781337106665
Author:
Luke M. Froeb, Brian T. McCann, Michael R. Ward, Mike Shor
Publisher:
Cengage Learning